
Gulf War Illness: C-Reactive Protein is Associated with Reduction of the Volume of Hippocampus and Decreased Fractional Anisotropy of the Fornix
Peka Christova1,2, Lisa M. James1,2,3, Adam F. Carpenter1,4, Scott M. Lewis1,4, Rachel A. Johnson1, Brian E. Engdahl1,2,5, Apostolos P. Georgopoulos1,2,3,4*
1Brain Sciences Center, Department of Veterans Affairs Health Care System, Minneapolis, MN, 55417, USA
2Department of Neuroscience, University of Minnesota Medical School, Minneapolis, MN 55455, USA
3Department of Psychiatry, University of Minnesota Medical School, Minneapolis, MN 55455, US
4Department of Neurology, University of Minnesota Medical School, Minneapolis, MN 55455, USA
5Department of Psychology, University of Minnesota Medical School, Minneapolis, MN 55455, USA
Abstract
Memory and mood impairments are among the most commonly reported symptoms in veterans with Gulf War Illness (GWI), suggesting hippocampal involvement. Several studies have also documented evidence of inflammation in GWI. The aim of the present study was to evaluate the association between C-reactive protein (CRP), a marker of inflammation, and hippocampal volume and microstructural alterations of its major output, the fornix. Sixty-three veterans with GWI provided blood samples for evaluation of CRP and underwent a 3T magnetic resonance imaging scan from which hippocampal volume and fornix fractional anisotropy (FA) were obtained. Results demonstrated that CRP was significantly and negatively associated with hippocampal volume and fornix FA in GWI. Given the known closely interwoven associations between inflammation and neurodegeneration, it is possible that the effects we observed could be due to neurodegeneration, secondary to chronic neuroinflammation. Finally, given the known association of hippocampus to memory and mood disorders, our findings provide new insights into memory and mood alterations associated with GWI.
Introduction
Nearly thirty years after the 1990-1991 Persian Gulf War, Gulf War veterans continue to report a variety of chronic, often disabling symptoms, commonly referred to as Gulf War Illness (GWI)1,2. The cause of GWI has not been conclusively identified; however, mounting evidence suggests GWI is best characterized as a neuroimmune disorder3,4, with several studies documenting various structural and functional brain abnormalities5-7 and evidence of elevated inflammatory markers such as C-reactive protein (CRP) in veterans with GWI8-11. Mood and memory impairments are particularly prominent among veterans with GWI2, suggesting hippocampal involvement; however, the effect of CRP on hippocampal alterations in GWI has not previously been investigated.
Several hippocampal abnormalities have been associated with GWI including reductions in total hippocampal and/or hippocampal subfield volume in Gulf War veterans exposed to organophosphates12-15, alterations in hippocampal cerebral blood flow following cholinergic challenge16, and reduced hippocampal N-acetyl apartate/creatinine ratio, indicative of neuronal and/or axonal loss or dysfunction17. Research using animal models of GWI have reported similar hippocampal alterations18-20, and have provided evidence that systemic and hippocampal inflammation underlie memory and mood impairment associated with GWI21, highlighting the likely influence of systemic inflammation on hippocampal macro- and microstructure.
The use of diffusion weighted imaging (DWI), has contributed to fundamental advances in human brain anatomy by providing a window to white matter microstructure22,23. DWI measures water molecule diffusion along different directions including in axons where water is constrained (by the myelin sheath) to diffuse mainly along the long axis of the axon. Basser and colleagues24,25 mathematically described the diffusion processes by a diffusion tensor, starting the field of a diffusion tensor imaging (DTI). DTI is the widely used for studying white matter changes in the healthy brain across the lifespan26-29, as well as in conditions affecting the brain30-35.
With regard to GWI, research using DTI has been limited and findings have been inconsistent. For example, Rayhan and colleagues suggested that increased axial diffusivity in the right inferior fronto-occipital fasciculus may be a biomarker of GWI36; however, that finding was not replicated in a subsequent study that reported increased axial diffusivity elsewhere37. A study of hippocampal gray matter microstructure in GW veterans with and without suspected in-theater exposure to organophosphates found that mean diffusivity predicted suspected in-theater organophosphate exposure15. The authors did not find evidence of differences in fractional anisotropy (FA) or gray matter density between the two exposure groups though they noted that FA is better suited to study microstructural changes in white matter than in gray matter.
One of the major white matter outputs of the hippocampus is the fornix, a bundle of fibers that connects the hippocampus to subcortical structures in the basal forebrain and diencephalon. This hippocampal-fornix circuitry is a part of the Papez circuit38. The fornix and hippocampus affect each other such that the damage to the integrity of the fornix causes disruption of hippocampal function and vice versa39-41. Hippocampal functional and structural abnormalities have been shown to be associated with fornix white matter integrity disruption in various conditions shown to be associated with fornix white matter disruption in various conditions, including conditions with prominent CNS inflammation such as multiple sclerosis and Alzheimer’s disease41-45.
Systemic inflammation influences blood-brain barrier (BBB) permeability46, and the hippocampus is particularly sensitive to BBB breakdown47. GWI has been associated with inflammation8-11, and, separately, inflammation has been linked to reduced hippocampal volume in GW veterans with posttraumatic stress disorder48. Finally, CRP is associated with cerebral microstructural integrity alterations as evidenced by reduced FA49. FA shows the degree of anisotropy and restriction of water diffusion by macromolecules and cell membranes. It varies in magnitude ranging from 0 to 1, depending on the characteristics of tissue microstructure50. Values close to 1 represent an almost unidirectional anisotropic diffusion, while lower values of FA can be the result of compromised white matter integrity.
Materials and Methods
Participants
Sixty-three GWI patients (59 men and 4 women) were studied after providing an informed consent in accordance with the Declaration of Helsinki. GWI status was determined using a self-report symptom checklist that permits classification as GWI case or control according to the Center for Disease Control1 and the Kansas criteria2. The Center for Disease Control definition requires one or more symptoms in at least two domains that include fatigue, pain, or mood and cognition. The more restrictive Kansas criteria requires that veterans report moderate to severe symptoms in at least 3 of 6 domains: fatigue, pain, neurological/cognitive/mood, skin, gastrointestinal, and respiratory. All GWI veterans in the present study met both case definitions. Consistent with the Kansas criteria case definition, veterans were excluded from the study if they reported medical or psychiatric conditions that could account for GWI symptoms or impair reporting2. Individuals with traumatic brain injury were also excluded from the study. The study was approved by the University of Minnesota and Minneapolis VA Health Care System Institutional Review Boards.
Body Mass Index (BMI)
BMI was computed using the height and weight of the participant (BMI = kg/m2).
CRP
Non-fasting peripheral venous blood samples were collected for evaluation of high sensitivity C- reactive protein and analyzed using standard procedures by the Minneapolis VAHCS Clinical Laboratory.
Magnetic Resonance Imaging (MRI) acquisition
All data were acquired using a Philips 3T MR scanner (Achieva, Philips Healthcare, Best, The Netherlands). In the initial phase of the study, data were acquired from 17 participants using a phased array SENSitivity Encoding (SENSE) 8-channel head coil for reception. For each participant a high resolution T1-weighted Turbo Field Echo (T1w TFE SENSE) was obtained (168 sagittal slices, TR = 8.1932 ms, TE =3.7520 ms, Acquisition matrix 240 × 240, Flip angel 8 deg., voxel size 0.9375 × 0.9375 × 1 mm). A T2-weighted image (T2w VISTA HR SENSE) was also obtained (180 slices, TR = 2500 ms, TE =363.072 ms, Acquisition matrix 252 × 252, voxel size =0.7813 ×0.7813 × 1 mm). Subsequently, upgrades were applied to the system and data were acquired from the remainder 46 participants using a phased array SENSitivity Encoding (SENSE) 15-channel head coil for reception. For each participant a high resolution T1-weighted Turbo Field Echo (T1w TFE SENSE) was obtained (168 sagittal slices, TR =8.0928 ms, TE = 3.698 ms, Acquisition matrix 240 × 240, Flip angel 8 deg., voxel size 0.7500 mm × 0.7500 mm × 1 mm). The T2-weighted (T2w VISTA HR SENSE) was also obtained (168 slices, TR = 2500 ms, TE = 370.346 ms, Acquisition matrix 240 × 240, voxel size = 0.7500 mm ×0.7500 mm × 1 mm).
Diffusion weighted images (DWI, DTI_medium_iso_E) consisted of a single-shot echo-planar imaging sequence (EPI, TR=11.023 s, TE = 55 ms, Acquisition matrix 112 x 112, 70 slices with 2 mm thickness without gap, in-plane resolution = 0.875 mm × 0.875 mm). Images were acquired in the axial plane with diffusion gradients applied in 15 non-collinear directions with a b-value of 1000 s/mm2 and one non-diffusion weighted image with a b-value of 0 s/mm2. In advance of each acquisition a capsule of Vitamin E was taped to the participant’s right temple to determine orientation in the imaged data.
MRI Image Processing
Structural MRI
A 704-core High Performance Computing system (CentOS 6.5 Linux, Rocks 6.1.1) with Matlab R2016 (64 bit), Human Connectome Project (HCP humanconnectome.org) pipeline with FreeSurfer (FS; http://surfer.nmr.mgh.harvard.edu) HCP version (freesurfer-hpc) was used for data processing, as we describe in detail elsewhere7. Briefly, we used a modified version of FS, implemented in the structural HCP pipeline, which utilizes both T1-w and T2-w images to eliminate uncertainty and improve pial surface reconstruction51. FS segments subcortical structures by using a volume-based analysis pipeline. In this analysis subcortical regions were automatically labeled52,53. The volumes of left and right hippocampi were averaged to obtain the average hippocampal volume that was used in subsequent analyses.
DTI
Diffusion data were analyzed using the default parameter settings in the diffusion MR toolbox ExploreDTI, version 4.8.6 (www.exploredti.com54). Anatomical T1-w images for each participant were linearly transformed into Montreal Neurological Institute (MNI) 152 space using AFNI (Analysis of Functional NeuroImages, afni.nimh.nih.gov). Diffusion weighted images were corrected for head movement and eddy current induced geometric distortions using the procedure described elsewhere54 and corrected for EPI/susceptibility distortion55. Then the image was warped to an ‘undistorted’ T1-w modality, in the MNI-152 template using the ELASTIX approach56 with non-rigid registration. The above steps were applied to the data obtained from each participant and done in one interpolation to reduce blurring effects, resulting in streamlined files. The quality of each processing step was visually inspected. The validity of co-registrations was checked by overlaying the respective images for each participant.
ExploreDTI provides the Mori standard labeled atlas in the same MNI standard space (ICBM-DTI-8157,58). By warping the atlas template and transforming the associate labels to each individual data set, the mean values of diffusion metric fractional anisotropy (FA) of the body and column of the fornix (called “fornix” thereafter) was obtained for each participant. The following formula was used for calculating FA:
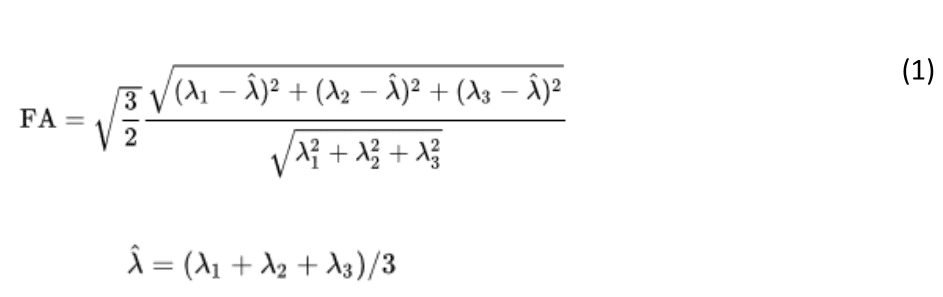
where is the mean of the eigenvalues of the diffusion tensor.
Data analysis
Standard statistical methods were used to analyze the data, including descriptive statistics and linear regression. Regression coefficients were compared, as needed, using the following formula59:
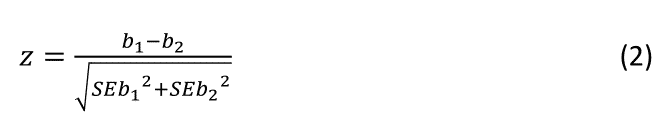
where z is the normal deviate, b1 and b2 denote regression coefficients to be compared, and SE are their standard errors. All statistical analyses were done using the IBM-SPSS statistical package (version 23).
Results
Distributions of data and descriptive statistics
Age. The frequency distribution of age is shown in Fig. 1; the mean ± SEM age was 55.2 ± 1.12 y.
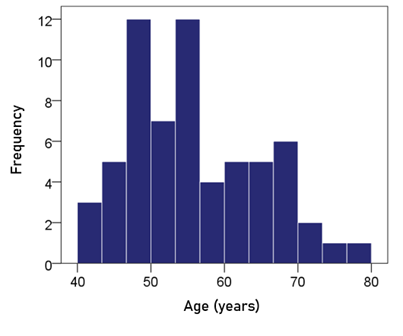
Figure 1: Frequency distribution of age. N = 63.
BMI. The mean ± SEM BMI was 31.3 ± 0.64 (N = 63).
CRP. The frequency distribution of CRP values (mg/dl) is shown in the left panel of Fig. 2. It can be seen that it is skewed to the right, deviating appreciably from a normal distribution, as evidenced by the probability-probability plot in right panel of Fig. 2. A logarithmic transformation was applied to bring the distribution close to normal (Fig. 3):
ln(CRP) = loge(CRP) (2)
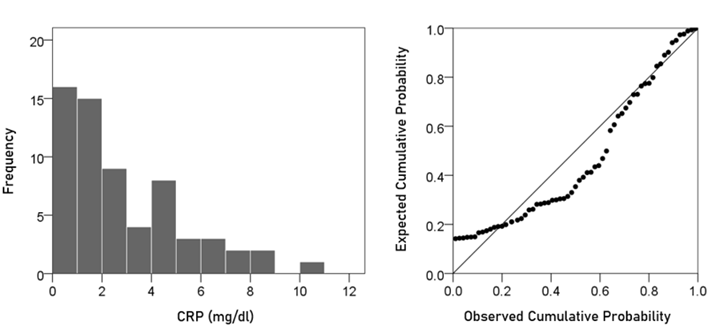
Figure 2: Frequency distribution of CRP (left panel) and corresponding probability-probability plot to indicate appreciable deviation from a normal distribution.
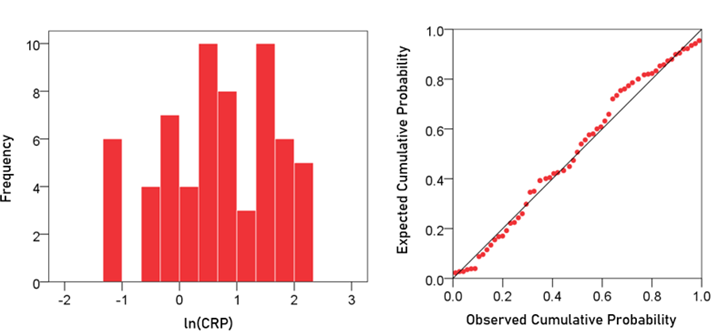
Figure 3: Frequency distribution of ln(CRP) (left panel) and corresponding probability-probability plot.
A detailed analysis of this distribution showed the absence of outliers. The mean ± SEM of ln(CRP) was 0.674 ± 0.122 (N = 63).
Volume of left hippocampus. The frequency distribution of the volume of the left hippocampus is shown in the left panel of Fig. 4; the mean ± SEM was 4205.32 ± 60.76 mm3 (N = 63).
Volume of right hippocampus. The frequency distribution of the volume of the right hippocampus is shown in the right panel of Fig. 4; the mean ± SEM was 4284.30 ± 64.05 mm3 (N = 63).
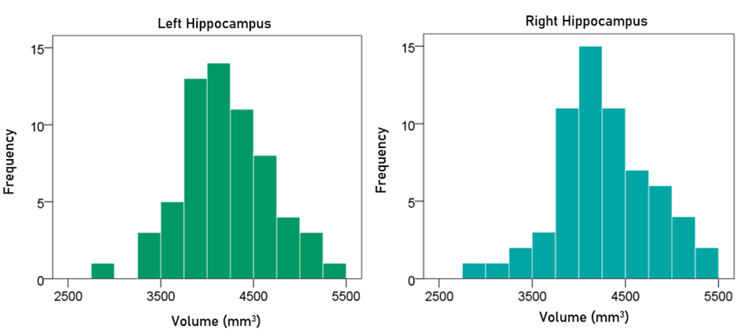
Figure 4: Frequency distribution of the volume of the left and right hippocampus (left and right panels, respectively).
Average volume of hippocampus. The frequency distribution of the volume of the averaged left and right hippocampus was 4244.81 ± 61.05 mm3 (N = 63).
Fractional anisotropy of the fornix. The frequency distribution of the FA of the fornix is shown in Fig. 5; the mean ± SEM was 0.433 ± 0.012.
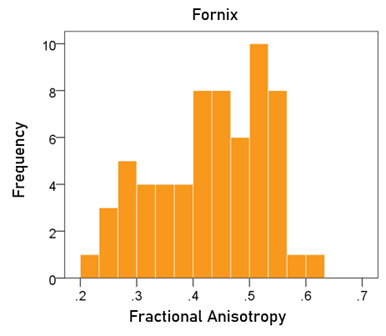
Figure 5: Frequency distribution of fractional anisotropy of the fornix.
Associations
Effect of total intracranial volume (eTIV). eTIV did not have a significant effect on the volumes of left, right, and average hippocampus (P > 0.1 for all; linear regression); therefore, eTIV was not used in subsequent analyses.
Effect of gender. Gender did not have a significant effect on the volumes of left, right, and average hippocampus, and the FA of fornix (P > 0.5 for all); therefore, gender was not used in subsequent analyses.
Effect of age. Age had a significant negative effect on the volumes of left, right, and average hippocampus, and the FA of fornix. The regression equations were as follows.
Left hippocampal volume (mm3) = 5374.71 – 20.92 y [P = 0.002; Fig. 6, left panel] (3)
Right hippocampal volume (mm3) = 5337.99 – 20.64 y [P = 0.004; Fig. 6, right panel] (4)
Average hippocampal volume (mm3) = 5406.35 – 20.78 y [P = 0.002; Fig. 7] (5)
Fornix FA = 0.761 – 0.00586 y [P = 0.00001; Fig. 8] (6)
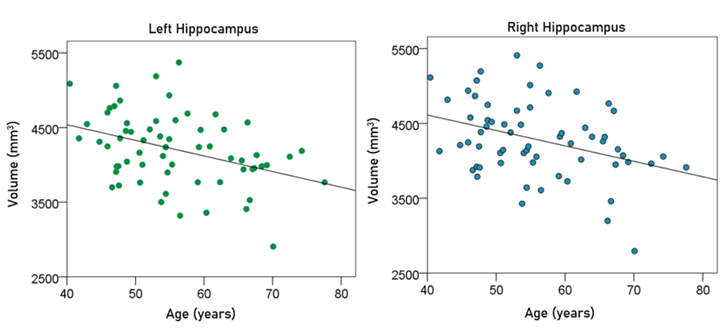
Figure 6: The volumes of left and right hippocampus are plotted against age in the left and right panel, respectively. See text for details.
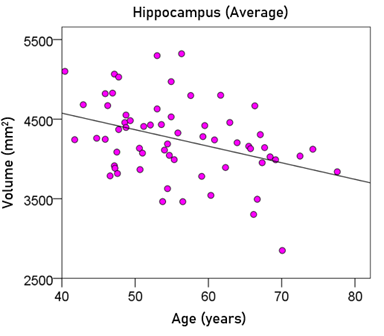
Figure 7: The average hippocampal volume is plotted against age. See text for details.
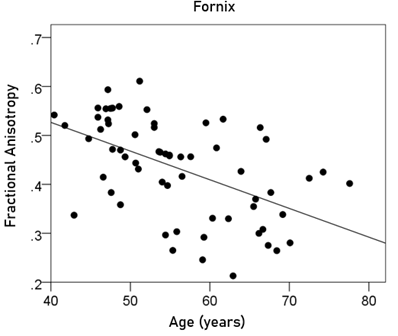
Figure 8: The FA of the fornix is plotted against age. See text for details.
Since age had a significant effect, it was added as a covariate in all subsequent analyses below. Finally, age and ln(CRP) were not significantly correlated (r = −0.146, P = 0.254).
Effect of BMI. BMI did not have a significant effect on the volumes of left, right, and average hippocampus, and the FA of fornix (P > 0.3 for all); therefore, BMI was not used in subsequent analyses.
Effect of CRP. CRP had a negative effect on the volumes of left, right, and average hippocampus, and the FA of fornix. This effect did not reach statistical significance for the left hippocampal volume but was significant for the other measures. The regression equations were as follows.
Left hippocampal volume (mm3) = 5546.72 – 22.68 y – 109.76 ln(CRP) (7)
[P for ln(CRP) = 0.065; Fig. 9, left panel]
Right hippocampal volume (mm3) = 5658.18 – 22.89 y – 140.51 ln(CRP) (8)
[P for ln(CRP) = 0.025; Fig. 9, right panel]
Average hippocampal volume (mm3) = 5602.45 – 22.78 y – 125.14 ln(CRP) (9)
[P for ln(CRP) = 0.025; Fig. 10]
Fornix FA = 0.808 – 0.00634 y – 0.03 ln(CRP) (10)
[P for ln(CRP) = 0.006; Fig. 11]
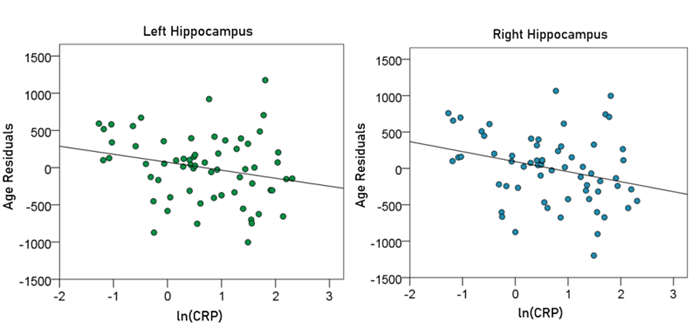
Figure 9: The residual volumes of the left and right hippocampus, after removing the age effect (from Equations 3 and 4, respectively), are plotted against ln(CRP) in the left and right panel, respectively. See text for details.
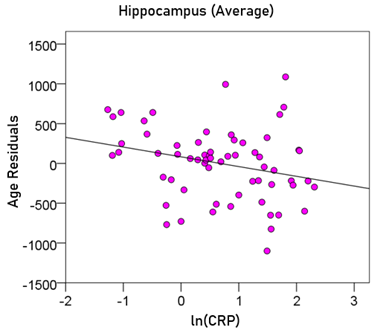
Figure 10: The residual volumes of the averaged hippocampus, after removing the age effect (from Equation 5), are plotted against ln(CRP). See text for details.
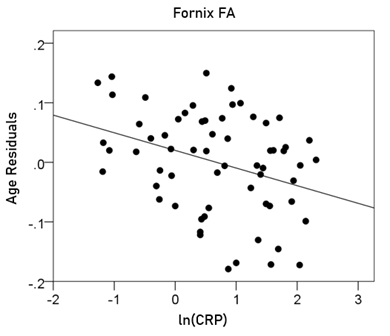
Figure 11: The residual volumes of the fornix FA, after removing the age effect (from Equation 6), are plotted against ln(CRP). See text for details.
Comparison of regression coefficients for age
A regression coefficient (slope, beta) indicates the rate by which the dependent variable changes per unit change of the independent variable. When estimated under different conditions, a comparison of coefficients between conditions could provide information regarding the possible effect of the condition on the coefficient. Here we compared the coefficients for age between the left and right hippocampal volumes to find out whether the effect of age differed significantly between the left and right hippocampi. The regression coefficients for age (and their standard errors in parentheses) were −20.92 (6.45) and −20.64 (6.87) for the left and right hippocampus, respectively. Applying the formula of Equation 2 above, we get z = 0.03, indicating that the two regression coefficients do not differ significantly. Therefore, age affects the volumes of the left and right hippocampus in the same way.
We also compared the regression coefficients for age obtained in the absence or presence of ln(CRP) as an additional covariate. A significant difference of the coefficients between the two cases would indicate a moderating effect of ln(CRP) on the age effect. In the absence of ln(CRP) as a covariate, the coefficients for age (and their standard errors in parentheses) were −20.92 (6.45), −20.64 (6.87), and −0.00586 (0.00122) for the left and right hippocampal volumes and FA of the fornix, respectively. In the presence of ln(CRP), those coefficients were −22.68 (6.39), −22.89 (6.71), and −0.00634 (0.001167) for the left and right hippocampal volumes and FA of the fornix, respectively. Using the formula of Equation 2 to compare corresponding coefficients, we get z = 0.193, z = 0.234, and z = 0.286 for left and right hippocampal volumes and fornix FA, respectively. These results indicate that the inclusion of ln(CRP) as a covariate did not alter the effect of age on hippocampal volumes and fornix FA.
Discussion
In this study, we examined the effect of inflammation, as assessed by CRP, on fornix microstructural integrity and gray matter hippocampal volume in GWI veterans. The findings demonstrated that higher CRP levels are associated with greater white matter fornix alterations and reduced hippocampal gray matter volume. The results further highlight the role of inflammation in GWI and document specific effects of inflammation on the hippocampus and fornix in GWI.
While the brain was historically thought to be immune-privileged, it is now widely recognized that the immune system and brain interact and profoundly influence each other60. Under healthy conditions, the brain’s resident immune cells, microglia, influence learning, memory, neural plasticity, and neurogenesis; however, chronic immune system activation impairs these processes and contributes to mood alterations61-63. GWI commonly involves memory and mood impairments2, and is increasingly viewed as a neuroimmune condition3,4. Several studies have documented inflammation in GWI8-11 with mounting evidence suggesting that pathogen exposure in those lacking immunogenetic protection contributes to GWI and associated inflammation64-70. Here we documented that peripheral inflammatory signaling is associated with white matter abnormalities and reduced gray matter volume in GWI. It has been shown that low-grade systemic inflammation alone may be enough to lead to neurological dysfunction71. Systemic inflammation may also directly contribute to microcirculatory dysfunction and cerebrovascular permeability72 and increased pro-inflammatory signaling within the central nervous system73.
Inflammation affects the brain by producing pro-inflammatory cytokines such as interleukin 6 (IL-6), interleukin-1β (IL-1β), tumor necrosis factor-α (TNFα), and reactive oxygen species61,74. Pro-inflammatory cytokines are measured in the serum in the periphery, but they are found as mediators of many central nervous system effects75 and have been shown to increase with age, stress, and fatigue76. Notably, a recent study found no elevation of peripheral pro-inflammatory cytokines in GWI compared to healthy controls despite evidence of neuroinflammation77. Others have also failed to find evidence of increased cytokines in GWI but have reported elevated CRP9,10, which had historically been thought to result from increased IL-6. Reevaluation of the causality between the inflammatory cytokines such as IL-6 and CRP found that they are inter-related and that they play both pro- and anti-inflammatory roles78, and that each can influence the other74. Using a more sensitive cytokine immunoassay, a recent study found increased IL-6 and CRP in veterans with GWI79.
Here we found CRP levels to be significantly and negatively correlated with fornix FA values and hippocampal volume, highlighting the influence of inflammation on both fornix microstructural integrity and hippocampal macrostructure. Notably, fornix degeneration has been shown to be correlated with hippocampal volume reductions across various conditions43,45,80-82, though the direction of the effects is unclear. For healthy adults the integrity of the fornix has been shown to predict hippocampal volume, but only for the oldest age group44. A longitudinal study of individuals at-risk for Alzheimer’s disease found that baseline hippocampal volume predicted fornix microstructure 2 years later but the reverse – FA predicting hippocampal volume - was not supported42. The current study documented significant negative associations between an inflammatory marker (CRP) and hippocampal measures of volume and white matter integrity. Given the known closely interwoven associations between inflammation and neurodegeneration83, it is possible that the effects we observed could be due to neurodegeneration, secondary to chronic neuroinflammation. Furthermore, because FA is a fairly non-specific indicator of microstructural architecture84, the exact nature of the microstructural alterations in GWI remain to be elucidated.
Limitations of the study
A limitation of the study concerns the possible partial volume effect of CSF contamination that may have affected the FA measurement of the fornix. In addition, our study did not permit differentiation of inflammation and neurodegeneration, especially given their intricate interrelations83.
Acknowledgements
This work was partially supported by the Department of Defense (Award Number W81XWH-15-1-0520), University of Minnesota (the American Legion Brain Sciences Chair) and the U.S. Department of Veterans Affairs. The sponsors had no role in the current study design, analysis or interpretation, or in the writing of this paper. The contents do not represent the views of the U.S. Department of Veterans Affairs or the United States Government.
Author Contributions
Contributed to data collection: LMJ, AFC, SML, RAJ. Contributed to participant recruitment and evaluation: BEE, LMJ, RAJ. Contributed to study design: APG, BEE, LMJ, AFC. Contributed to data analysis: APG, PC. Wrote the paper: LMJ, PC, APG. Contributed to editing the paper: All.
Conflicts of Interest
None.
References
- Fukuda K, Nisenbaum R, Stewart G, et al. Chronic multisymptom illness affecting Air Force veterans of the Gulf War. JAMA. 1998; 280: 981-988.
- Steele L. Prevalence and patterns of Gulf War illness in Kansas veterans: association of symptoms with characteristics of person, place, and time of military service. Am J Epidemiol. 2000; 152: 992-1002.
- Georgopoulos AP, James LM, Carpenter AF, et al. Gulf War illness (GWI) as a neuroimmune disease. Exp Brain Res. 2017; 235(10): 3217-3225.
- Coughlin SS. A neuroimmune model of Gulf War Illness. J Environ Health Sci. 2017; 3: 10.15436/2378-6841.17.1665.
- White RF, Steele L, O'Callaghan JP, et al. Recent research on Gulf War illness and other health problems in veterans of the 1991 Gulf War: effects of toxicant exposures during deployment. Cortex. 2016; 74: 449-475.
- Engdahl BE, James LM, Miller RD, et al. A magnetoencephalographic (MEG) study of Gulf War Illness (GWI). EBioMedicine. 2016; 12: 127-32.
- Christova P, James LM, Engdahl BE, et al. Subcortical brain atrophy in Gulf War Illness. Exp Brain Res. 2017; 235: 2777-2786.
- James LA, Engdahl BE, Johnson RA, et al. Gulf War Illness and Inflammation: Association of symptom severity with C-reactive protein. J Neurol Neuromed. 2019; 4(2): 15-19.
- Johnson GJ, Leis LA, Slater BC, et al. Elevated platelet count, C-reactive protein and thromboxane analog-induced platelet aggregation in patients with Gulf War veterans' illnesses: evidence of a chronic inflammatory state? Blood Coagul Fibrinolysis. 2013; 24: 736–741.
- Johnson GJ, Slater BC, Leis LA, et al. Blood biomarkers of chronic inflammation in Gulf War Illness. PLoS One. 2016; 11(6): e0157855.
- Kelsall HL, McKenzie DP, Sim MR, et al. Physical, psychological, and functional comorbidities of multisymptom illness in Australian male veterans of the 1991 Gulf War. Am J Epidemiol. 2009; 170: 1048–1056.
- Chao LL, Rothlind JC, Cardenas VA, et al. Effects of low-level exposure to sarin and cyclosarin during the 1991 Gulf War on brain function and brain structure in US veterans Neurotoxicology. 2010; 31(5): 493–501.
- Chao LL, Kriger S, Buckley S, et al. Effects of low-level sarin and cyclosarin exposure on hippocampal subfields in Gulf War Veterans. Neurotoxicology. 2014; 44: 263-269.
- Chao LL, Raymond MR, Leo, CK, et al. Evidence of hippocampal structural alterations in Gulf War Veterans with predicted exposure to the Khamisiyah Plume. J Occup Enviro Med. 2017; 59(10): 923-929.
- Chao LL, Zhang Y. Effects of low-level sarin and cyclosarin exposure on hippocampal microstructure in Gulf War Veterans. Neurotoxicol Teratol. 2018; 68: 36-46.
- Li X, Spence JS, Buhner DM, et al. Hippocampal dysfunction in Gulf War veterans: investigation with ASL perfusion MR imaging and physostigmine challenge. Radiology. 2011; 261(1): 218–225.
- Menon PM, Nasrallah HA, Reeves RR, et al. Hippocampal dysfunction in Gulf War Syndrome. A proton MR spectroscopy study. Brain Res. 2004; 1009(1-2): 189-94.
- Abdel-Rahman A, Abou-Donia SM, El-Masry EM, et al. Stress and combined exposure to low doses of pyridostigmine bromide, DEET, and permethrin produce neurochemical and neuropathological alterations in cerebral cortex, hippocampus, and cerebellum. J Toxicol Environ Health A. 2004; 67(2): 163-192.
- Parihar VK, Hattiangady B, Shuai B, et al. Mood and memory deficits in a model of Gulf War illness are linked with reduced neurogenesis, partial neuron loss, and mild inflammation in the hippocampus. Neuropsychopharmacology. 2013; 38(12): 2348-2362.
- Phillips KF, Deshpande LS. Chronic neurological morbidities and elevated hippocampal calcium levels in a DFP-based rat model of Gulf War Illness. Mil Med. 2018; 183(suppl_1): 552-5.
- Shetty GA, Hattiangady B, Upadhya D, et al. Chronic oxidative stress, mitochondrial dysfunction, Nrf2 activation and inflammation in the hippocampus accompany heightened systemic inflammation and oxidative stress in an animal model of gulf war illness. Front Mol Neurosci. 2017; 10: 182.
- Le Bihan D, Breton E, Lallemand D, et al. MR imaging of intravoxel incoherent motions: application to diffusion and perfusion in neurologic disorders. Radiology. 1986; 161(2):401–7.
- Le Bihan D. Molecular diffusion nuclear magnetic resonance imaging. Magn Reson Q. 1991; 7(1): 1–30.
- Basser PJ, Mattiello J, LeBihan D. MR diffusion tensor spectroscopy and imaging. Biophys J. 1994; 66(1): 259–67.
- Basser PJ, Mattiello J, LeBihan D. Estimation of the effective self-diffusion tensor from the NMR spin echo. J Magn Reson. 1994; 103: 247-254.
- Bava S, Thayer R, Jacobus J, et al. Longitudinal characterization of white matter maturation during adolescence. Brain Res. 2010; 1327: 38–46.
- Gao W, Lin W, Chen Y, et al. Temporal and spatial development of axonal maturation and myelination of white matter in the developing brain. Am J Neuroradiol. 2009; 30(2): 290–6.
- Molloy CJ, Nugent S, Bokde ALW. Alterations in diffusion measures of white matter integrity associated with healthy aging. J Gerontol A Biol Sci Med Sci. 2019; glz289.
- Pietrasik W, Cribben I, Olsen F, et al. Diffusion tensor imaging of the corpus callosum in healthy aging: Investigating higher order polynomial regression modelling. NeuroImage. 2020; 213:116675.
- Tae WS, Ham BJ, Pyun SB, et al. Current clinical applications of diffusion-tensor imaging in neurological disorders. J Clin Neurol. 2018; 14(2): 129-40.
- Racine AM, Merluzzi AP, Adluru N, et al. Association of longitudinal white matter degeneration and cerebrospinal fluid biomarkers of neurodegeneration, inflammation and Alzheimer’s disease in late-middle-aged adults. Brain Imaging Behav. 2019; 13(1): 41–52.
- Costallat BL, Ferreira DM, Lapa AT, et al. Brain diffusion tensor MRI in systematic lupus erythematosus: A systematic review. Autoimmun Rev. 2018; 17(1): 36-43.
- Shepherd AM, Laurens KR, Matheson SL, et al. Systematic meta-review and quality assessment of the structural brain alterations in schizophrenia. Neurosci Biobehav Rev. 2012; 36(4): 1342-56.
- Sexton CE, Mackay CE, Ebmeier KP. A systematic review of diffusion tensor imaging studies in affective disorders. Biol Psychiatry. 2009; 66(9): 814-23.
- Baek SH, Park J, Kim YH, et al. Usefulness of diffusion tensor imaging findings as biomarkers for amyotrophic lateral sclerosis. Sci Rep. 2020; 10(1): 5199.
- Rayhan RU, Stevens BW, Raksit MP, et al. Exercise challenge in Gulf War Illness reveals two subgroups with altered brain structure and function. PLoS One. 2013; 8(6): e63903.
- Chao LL, Zhang Y, Buckley S. Effects of low-level sarin and cyclosarin exposure on white matter integrity in Gulf War Veterans. Neurotoxicology. 2015; 48: 239-48.
- Papez JW. A proposed mechanism of emotion. Arch NeurPsych. 1937; 38(4): 725–43.
- Cassel JC, Duconseille E, Jeltsch H, et al. The fimria-fornix/singular bundle pathways: a review of neurochemical and behavioural approaches using lesions and translation techniques. Prog Neurobiol. 1997; 51(6): 663–716.
- Aggleton JP, Brown MW. Episodic memory, amnesia and the hippocampal - anterior thalamic axis. Behav Brain Sci. 1999; 22(3): 425–44.
- Wang P, Zhou B, Yao H, et al. Aberrant hippocampal functional connectivity is associated with fornix white matter integrity in Alzheimer’s Disease and mild cognitive impairment. J Alzheimers Dis. 2020; 75(4); 1153-1168.
- Yu J, Lee TMC. Verbal memory and hippocampal volume predict subsequent fornix microstructure in those at risk for Alzheimer’s disease. Brain Imaging Behavior. 2019. Doi: 10.1007/s11682-019-00183-8.
- Koenig KA, Sakaie KE, Lowe MJ, et al. Hippocampal volume is related to cognitive decline and fornicial diffusion measures in multiple sclerosis. Magn Reson Imaging. 2014; 32(4): 354–8.
- Gazes Y, Li P, Sun E, et al. Age specificity in fornix-to-hippocampus association. Brain Imaging Behav. 2019; 13(5): 1444–52.
- Baumann PS, Griffa A, Fournier M, et al. Impaired fornix–hippocampus integrity is linked to peripheral glutathione peroxidase in early psychosis. Transl Psychiatry. 2016; 6(7): e859.
- Elwood E, Lim Z, Naveed H, et al. The effect of systemic inflammation on human brain barrier function. Brain Behav Immun. 2017; 62: 35–40.
- Montagne A, Barnes SR, Sweeney MD, et al. Blood-brain barrier breakdown in the aging human hippocampus. Neuron. 2015; 85(2): 296-302.
- O’Donovan A, Chao LL, Paulson J, et al. Altered inflammatory activity associated with reduced hippocampal volume and more severe posttraumatic stress symptoms in Gulf War veterans. Psychoneuroendocrinology. 2015; 51: 557-66.
- Wersching H, Duning T, Lohmann H, et al. Serum C-reactive protein is linked to cerebral microstructural integrity and cognitive function. Neurology. 2010; 74(3): 1022-1029.
- Pierpaoli C, Barnett A, Pajevic S, et al. Water diffusion changes in Wallerian degeneration and their dependence on white matter architecture. NeuroImage. 2001; 13: 1174–1185.
- Glasser MF, Sotiropoulos SN, Wilson JA, et al. The minimal preprocessing pipelines for the human connectome project. NeuroImage. 2013; 80: 105–124.
- Fischl B, Salat DH, Busa E, et al. Whole brain segmentation: automated labeling of neuroanatomical structures in the human brain. Neuron. 2002; 33: 341–355.
- Fischl B, van der Kouwe A, Destrieux C, et al. Automatically parcellating the human cerebral cortex. Cereb Cortex. 2004; 14: 11–22.
- Leemans A, Jeurissen B, Sijbers J, et al. “Explore DTI: A graphical toolbox for processing, analyzing, and visualizing diffusion MRI data”. Proceedings of the 17th Scientific Meeting, International society for Magnetic Resonace in medicine, Honolulu, USA, p. 3537, 2009.
- Irfanoglu MO, Walker L, Sarlls J, et al. Effects of image distortions originating from susceptibility variations and concomitant fields on diffusion MRI tractography results. NeuroImage. 2012; 61(1): 275–88.
- Klein S, Staring M, Murphy K, et al. Elastix: A toolbox for intensity-based medical image registration. IEEE Trans Med Imaging. 2010; 29(1): 196–205.
- Mori S, Oishi K, Jiang H, et al. Stereotaxic white matter atlas based on diffusion tensor imaging in an ICBM template. NeuroImage. 2008; 40(2): 570–82.
- Mori S, Wakana S, Zijl PCM van, et al. MRI Atlas of Human White Matter. Elsevier; 2005.
- Paternoster R, Brame R, Mazerolle P, et al. Using the correct statistical test for the equality of regression coefficients. Criminolgy. 1998; 36: 859-866.
- Dantzer R. Neuroimmune interactions: from the brain to the immune system and vice versa. Physiol Rev. 2018; 98(1): 477-504.
- Dantzer R, O’Connor JC, Freund GG, et al. From inflammation to sickness and depression: when the immune system subjugates the brain. Nat Rev Neurosci. 2008; 9: 46–56.
- Kohman RA, Rhodes JS. Neurogenesis, inflammation and behavior. Brain Behav Immun. 2013; 27: 22–32.
- Bitzer-Quintero OK, Gonzalez-Burgos I. Immune system in the brain: a modulatory role on dendritic spine morphophysiology? Neural Plast. 2012; e348642.
- Georgopoulos AP, James LM, Mahan MY, et al. Reduced Human Leukocyte Antigen (HLA) protection in Gulf War Illness (GWI). EBioMedicine. 2016; 3: 79-85.
- James LM, Christova P, Engdahl BE, et al. Human leukocyte antigen (HLA) and Gulf War Illness (GWI): HLA-DRB1*13:02 spares subcortical atrophy in Gulf War veterans. EBioMedicine. 2017; 26: 126-131.
- Tsilibary EPC, Souto EP, Kratzke M, et al. Anthrax and Gulf War Illness (GWI): Evidence for the Presence of Harmful Anthrax Antigen PA63 in the Serum of Veterans with GWI. J Neurol Neuromed. 2019; 4(6): 1-9.
- Tsilibary EPC, Souto EP, Kratzke M, et al. Anthrax Protective Antigen 63 (PA63): toxic effects in neural cultures and role in Gulf War Illness (GWI). Neurosci Insights; in press.
- Charonis S, James LM, Georgopoulos AP. In silico analysis of the binding affinities of antigenic epitopes of vaccines administered to Gulf War Veterans to specific HLA Class II alleles protective for Gulf War Illness. J Neurol Neuromed. 2019; 4(5): 23-30.
- Georgopoulos AP, Tsilibary EP, Souto EP, et al. Adverse effects of Gulf War Illness (GWI) serum on neural cultures and their prevention by healthy serum. J Neurol Neuromed. 2018; 3(2): 19-27.
- Tsilibary CEP, Souto EP, James LM, et al. Human immunoglobulin G (IgG) neutralizes adverse effects of Gulf War Illness (GWI) serum in neural cultures: Paving the way to immunotherapy for GWI. J Neurol Neuromed. 2018; 3(5): 23-28.
- Cunningham C, Hennessy E. Co-morbidity and systemic inflammation as drivers of cognitive decline: new experimental models adopting a broader paradigm in dementia research. Alzheimers Res Ther. 2015; 7(1): 33.
- Abbott NJ. Inflammatory mediators and modulation of blood–brain barrier permeability. Cell Mol Neurobiol. 2000; 20(2): 131–47.
- Carret-Rebillat AS, Pace C, Gourmaud S, et al. Neuroinflammation and Aβ accumulation linked to systemic inflammation are decreased by genetic PKR down-regulation. Sci Rep. 2015; 5(1): 8489.
- Sproston NR, Ashworth JJ. Role of C-reactive protein at sites of inflammation and infection. Frontiers Immunol. 2018; 9: 754.
- You Z, Luo C, Zhang W, et al. Pro- and anti-inflammatory cytokines expression in rat’s brain and spleen exposed to chronic mild stress: Involvement in depression. Behav Brain Res. 2011; 225(1): 135–41.
- Rohleder N, Aringer M, Boentert M. Role of interleukin-6 in stress, sleep, and fatigue. Annals N Y Acad Sci. 2012; 1261(1): 88–96.
- Alshelh Z, Albrecht DS, Bergan C, et al. In-vivo imaging of neuroinflammation in veterans with Gulf War illness. Brain Behav Immun. 2020; 87: 498–507.
- Del Giudice M, Gangestad SW. Rethinking IL-6 and CRP: Why they are more than inflammatory biomarkers, and why it matters. Brain Behav Immun. 2018; 70: 61–75.
- Butterick TA, Trembley JH, Hocum Stone LL, et al. Gulf War Illness-associated increases in blood levels of interleukin 6 and C-reactive protein: biomarker evidence of inflammation. BMC Res Notes. 2019; 12(1): 816.
- Douaud G, Menke RAL, Gass A, et al. Brain microstructure reveals early abnormalities more than two years prior to clinical progression from mild cognitive impairment to Alzheimer’s Disease. J Neurosci. 2013; 33(5): 2147–55.
- Mielke MM, Okonkwo OC, Oishi K, et al. Fornix integrity and hippocampal volume predict memory decline and progression to Alzheimer’s disease. Alzheimers Dement. 2012; 8(2): 105–13.
- Zhuang L, Sachdev PS, Trollor JN, et al. Microstructural white matter changes, not hippocampal atrophy, detect early amnestic mild cognitive impairment. PLOS ONE. 2013; 8(3): e58887.
- Chitnis T, Weiner HL. CNS inflammation and neurodegeneration. J Clin Invest. 2017; 127(10): 3577-3587.
- Alexander AL, Lee JE, Lazar M, et al. Diffusion tensor imaging of the brain. Neurotherapeutics. 2007; 4(3): 316–29.