
Feasibility study for remote assessment of cognitive function in multiple sclerosis
Michaela F. George, PhD1*, Calliope B. Holingue, MPH1*, Farren B.S. Briggs, PhD, ScM2, Xiaorong Shao, MA1, Kalliope H. Bellesis3, Rachel A. Whitmer, PhD3, Catherine Schaefer, PhD3, Ralph HB Benedict, PhD4, Lisa F. Barcellos, PhD, MPH1,3,5
1Division of Epidemiology, Genetic Epidemiology and Genomics Laboratory, School of Public Health, University of California, Berkeley, CA, USA
2Department of Epidemiology and Biostatistics, School of Medicine, Case Western Reserve University, Cleveland, OH, USA
3Kaiser Permanente Division of Research, Oakland, CA, USA
4Jacobs MS Center, SUNY Buffalo School of Medicine, Buffalo, NY, USA
Abstract
Background
Cognitive impairment is common in multiple sclerosis (MS), and affects employment and quality of life. Large studies are needed to identify risk factors for cognitive decline. Currently, a MS-validated remote assessment for cognitive function does not exist. Studies to determine feasibility of large remote cognitive function investigations in MS have not been published.
Objective
To determine whether MS patients would participate in remote cognitive studies. We utilized the Modified Telephone Interview for Cognitive Status (TICS-M), a previously validated phone assessment for cognitive function in healthy elderly populations to detect mild cognitive impairment. We identified factors that influenced participation rates. We investigated the relationship between MS risk factors and TICS-M score in cases, and score differences between cases and control individuals.
Methods
The TICS-M was administered to MS cases and controls. Linear and logistic regression models were utilized.
Results
11.5% of eligible study participants did not participate in cognitive testing. MS cases, females and individuals with lower educational status were more likely to refuse (p<0.001). Cases who did complete testing did not differ in terms of perceived cognitive deficit compared to cases that did participate. More severe disease, smoking, and being male were associated with a lower TICS-M score among cases (p<0.001). The TICS-M score was significantly lower in cases compared to controls (p=0.007).
Conclusions
Our results demonstrate convincingly that a remotely administered cognitive assessment is quite feasible for conducting large epidemiologic studies in MS, and lay the much needed foundation for future work that will utilize MS-validated cognitive measures.
Introduction
Multiple Sclerosis (MS) symptoms vary greatly, but cognitive impairment may affect 40-70% of patients1–3. Cognitive processing speed (CPS) and episodic memory are most often involved, both having adverse impact on employment and quality of life4–9.
Full characterization of cognitive ability in MS requires psychometric assessment of CPS and memory, using tests with established validity in MS samples. These tests may be brief, but typically require a one-on-one clinical evaluation with a psychologist or similarly trained professional. This approach is not practical for large-scale clinical, genetic or epidemiologic studies, which require an abundance of information to be collected on hundreds or thousands of participants. Thus, an easily administered, inexpensive and sensitive screening or monitoring assessment that could be given remotely would facilitate large sample studies of cognitive health in MS, and could also facilitate early identification of cognitive deficits. Currently, there is no formally validated test to assess MS cognitive function remotely. Further, feasibility studies involving remote testing of a large number of MS patients derived from a population representative sample have not been attempted.
We investigated cognitive function in a large sample of MS cases and controls using the Modified Telephone Interview for Cognitive Status (TICS-M), a telephone based assessment of cognitive function which was initially developed to screen for mild cognitive impairment and Alzheimer disease, and has been previously validated in a healthy elderly population10,11. We examined factors influencing participation and tested for associations between the TICS-M score and: 1) sex, 2) measures of physical disability, and 3) established genetic and environmental susceptibility factors in MS cases. We also compared TICS-M scores between case and control groups, and TICS-M scores with a standardized measure of self-perceived cognitive function in case and control groups.
Materials and Methods
Study Population
MS cases and controls (n=1,700; 1,078 cases and 622 controls) were recruited from the Kaiser Permanente Medical Care Plan in Northern California Region (KPNC); an integrated health services delivery system with 3.3 million members in a 22-county service area in Northern California. KPNC membership is generally representative of the general population with respect to demographic characteristics; although, individuals from impoverished neighborhoods are underrepresented12. The study protocol was approved by the Institutional Review Boards of UC Berkeley and Kaiser Permanente Division of Research. All study participants provided written informed consent. MS cases met well-established disease criteria, as defined by McDonald et al13. MS cases were identified through electronic health records (EHR), as any KPNC member with at least one outpatient diagnosis of MS by a neurologist (multiple sclerosis, ICD9 code 340.xx); 95% had at least two MS diagnoses by a neurologist at study entry. Controls were randomly selected from current KPNC members without a diagnosis of MS or related condition (optic neuritis, transverse myelitis, or demyelination disease; ICD9 codes: 340, 341.0, 341.1, 341.2, 341.20, 341.21, 341.22, 341.8, 341.9, 377.3, 377.30, 377.39, and 328.82) confirmed through EHR. Other than these exclusions, all other individuals were eligible. All participants were 18-69 years of age, white non-Hispanic, and KPNC members at the time of initial contact. Length of membership in KPNC was similar in cases and controls14. At the time of the data freeze (December 2010), the average participation rate for the KPNC MS Research Program was 58% for controls and 79% for cases.
Exposure and Clinical Data Collection
Study participants completed a computer assisted telephone interview (CATI) administered by trained staff at study entry. Environmental exposure data included history of tobacco smoking (ever/never), history of infectious mononucleosis (IM; ever/never), parental and self-education level (7-level scale, doctoral degree=0 to less than high school=6), family history of MS (first degree relatives), current body mass index (BMI; kilograms/meters2), and history of vitamin D supplementation (ever/never) (Table 1). Current and past history of depression were also collected15. History of depression was categorized as ever if the participant answered yes to either of the following questions: “Have you ever had a period of at least two weeks when you were bothered most of the day, nearly every day, by feeling depressed, sad, down, or low?” or “Have you ever had a period of at least two weeks when you did not enjoy most things, even things you usually like to do?”, and the participant reported having at least four symptoms of depression during that period. Participants who answered no to the proceeding questions but answered yes to one of the following questions: “Have you ever had a period of at least two weeks when you were bothered most of the day, nearly every day, by feeling irritable?” or “…by feeling anxious?”, and who reported having at least five symptoms of depression during that period, were also defined as having a history of depression. Depressive periods had to last at least two weeks. Current depression was defined based on answering yes to the question: “Are you currently experiencing an episode of depression?” The current depressive episode was required to last at least two weeks. Age of onset of MS was determined as year of first self-reported clinical symptom, based on the following questions: “How old were you when you had your first clinical symptoms of MS?”, “What were your first clinical symptoms of MS?” Information was collected from each MS case regarding the physical location of symptom onset for both first (and second) clinical attack. Year for disease onset was calculated using date of birth. Age of onset in the current study relied on the appearance of clinical symptoms only and was verified in the EHR when possible. Disease duration was calculated as time between age of symptom onset and interview date, rounded to nearest year. Disease course was categorized as relapsing-remitting/secondary progressive or other (primary progressive, progressive relapsing or unknown), based on clinical history. Disease modifying therapy (DMT) use was collected through interview and confirmed in the EHR. Further, the CATI included the Perceived Deficits Questionnaire (PDQ)16, which was developed for MS to provide a self-reported measure of cognitive status, assessing attention, retrospective memory, prospective memory, and planning and organization. All participants completed the 5-item PDQ, and were asked to indicate how frequently they experienced each cognitive difficulty in each area, based on a 5-point scale ranging from 0 (never) to 4 (almost always). Total PDQ scores range from 0 to 20; higher scores represent greater perceived impairment.
Disease severity was measured using the Multiple Sclerosis Severity Score (MSSS)17, and was based on self-reported current ambulatory status and disease duration. Self-report of neurological impairment in MS has been previously validated18. The MSSS for each case in the current study was assigned using Global MSSS reference data derived from a large independent cohort of 9,892 patients with EDSS and disease duration ranging from 1 to >30 years17. The MSSS can range from 0-10 and was analyzed as a continuous variable, and as two dichotomous variables19: a binary MSSS variable was based on the median MSSS value (MSSS ≤5 vs. >5) with a smaller score indicating more ‘mild’ disease. The second dichotomous variable was based on extreme ends of the MSSS distribution, defined as MSSS <2.5 (‘mild’) vs. ≥7.5 (‘severe’) (Table 1).
| Cases Mean (SD) or Frequency (%) |
Controls Mean (SD) or Frequency (%) |
P-value | ||||
|---|---|---|---|---|---|---|
| Number of individuals | 921 | 553 | -- | |||
| Cognitive Score (TICS-M) | 22.4 (3.8) | 23.0 (3.5) | 0.001 | |||
| Orientation | 5.5 (1.1) | 5.8 (0.7) | <0.001 | |||
| Registration | 4.68 (1.7) | 4.9 (1.6) | 0.011 | |||
| Calculation | 4.0 (1.5) | 4.0 (1.4) | 0.95 | |||
| Comprehension | 5.0 (0.3) | 5.0 (0.2) | 0.038 | |||
| Language | 0.9 (0.2) | 0.9 (0.2) | 0.33 | |||
| Delayed-recall | 3.2 (1.6) | 3.5 (1.6) | 0.004 | |||
| Year of birth | 1958 (8.9) | 1957 (8.2) | 0.15 | |||
| Female | 722 (78.4) | 464 (83.9) | 0.01 | |||
| Smoking (ever) | 462 (50.2) | 262 (40.9) | 0.001 | |||
| IM (ever) | 233 (25.6) | 75 (13.7) | <0.001 | |||
| Education | -- | -- | 0.008 (Self) 0.14 (Parental) |
|||
| Self | Parental | Self | Parental | |||
| Less than high school | 0 | 26 (2.8) | 2 (0.4) | 11 (2.0) | -- | |
| High school graduate or GED | 13 (1.4) | 30 (3.3) | 5 (0.9) | 17 (3.1) | -- | |
| Some college or technical/ trade/vocational school | 116 (12.6) | 272 (29.5) | 55 (10.0) | 166 (30.0) | -- | |
| Associate’s degree | 357 (38.8) | 228 (24.8) | 189 (34.2) | 110 (19.9) | -- | |
| Bachelor’s degree | 269 (29.2) | 212 (23.0) | 181 (32.7) | 145 (26.2) | -- | |
| Master’s degree | 134 (14.6) | 98 (10.6) | 95 (17.2) | 66 (11.9) | -- | |
| Doctoral degree | 32 (3 4) | 55 (6.0) | 26 (4.7) | 38 (6.9) | -- | |
| Family history of MS | 78 (8.5) | 12 (2.2) | <0.001 | |||
| BMI (kg/m2) | 26.9 (6.4) | 26.9 (5.8) | 0.99 | |||
| Vitamin D supplements (ever) | 277 (30.3) | 133 (24.4) | 0.016 | |||
| History of depression | 0.042 | |||||
| No | 416 (45.2) | 287 (51.9) | -- | |||
| Yes | 323 (35.1) | 173 (31.3) | -- | |||
| Don’t know | 182 (19.8) | 93 (16.8) | -- | |||
| Current depression (yes) | 98 (10.6) | 30 (5.4) | 0.001 | |||
| PCDS (5 item) | 5.9 (5.5) | 2.7 (3.6) | <0.0001 | |||
| HLA-DRB1*15:01 (positive/negative) | 491 (53.3) | 156 (28.2) | <0.001 | |||
| MSSS Continuous | 3.4 (2.6) | -- | -- | |||
| MSSS Binary (high) | 215 (23.8) | -- | -- | |||
| MSSS Extreme (high) | 109 (20.1) | -- | -- | |||
| Age of onset (years) | 32.0 (9.7) | -- | -- | |||
| Disease duration (years) | 12.1 (8.5) | -- | -- | |||
| Disease course | -- | -- | ||||
| RRMS/SPMS | 764 (83.0) | -- | -- | |||
| Other | 156 (17.0) | -- | -- | |||
| DMT (ever) | 711 (77.2) | -- | -- | |||
Table 1: Characteristics of the Kaiser Permanente Northern California Region (KPNC) MS Cases and Control Individuals
Abbreviations: SD = standard deviation, TICS-M = modified Telephone Interview for Cognitive Status, IM = infectious mononucleosis, BMI = body mass index, MSSS = MS severity score, RRMS = relapsing remitting MS, SPMS = secondary progressive MS, DMT = disease modifying therapy. PCDS = perceived cognitive deficit score. Education (self and parental) was coded as 0=doctoral degree to 7=less than high school, indicating that less education is a risk factor. Student’s T-test was used to compare continuous variables between cases and controls; chi-square statistic compared categorical variables.
Cognitive Score (TICS-M)
The TICS-M is a cognitive function test developed as a screening assessment for mild cognitive impairment/dementia that can be administered in person or by telephone10,11,20. As part of the CATI, each participant was asked 14 questions to assess orientation; registration and free recall; attention and calculation; comprehension; semantic recent memory; language and repetition; and delayed recall. These areas were also considered as TICS-M subscores for analysis. The high item difficulty of the memory task gives TICS-M more discriminatory power in terms of cognitive performance of the general population compared to the mini-mental status exam (MMSE)11. The TICS-M is scored as the unweighted sum of correct answers with a maximum of 37 possible points. Each participant TICS-M score was corrected for self-reported education level21. A total of 11.5% of KPNC MS Research Program study participants (138 cases and 59 controls of 1,700 individuals) did not wish to complete the TICS-M assessment. These individuals were considered non-participants for remote cognitive assessment, and were compared with remote cognitive assessment participants for clinical and demographic similarities and differences.
Genotyping
Biospecimens were collected as described14. DNA samples were genotyped using Illumina’s Human 660K BeadChip; genotypes were further imputed using the 1000 Genome Reference, IMPUTE2 and standard procedures23. HLA-DRB1*15:01 genotype status was assigned as described22. Analyses were restricted to participants who clustered in a homogenous subset based on two dimensions of separation by classical multidimensional scaling (PLINK v1.07) 24. A total of 29 individuals were removed. Our final dataset for analysis included 921 cases and 553 controls, for whom full clinical, genetic, exposure and TICS-M data were available.
Statistical Analyses
Student’s T-test and the chi-square statistic were used to compare the distribution of variables between MS cases and controls (Table 1) and between participants and non-participants for remote cognitive assessment (TICS-M). Logistic regression models were used to estimate beta values (β) or odds ratio (OR), respectively, and 95% confidence intervals (95% CIs), for the association between the outcome of participating in remote cognitive assessment and the following predictors: case status, sex, PDQ score, history of smoking, age, measures of education and depression at study entry.
Unadjusted and adjusted linear and logistic regression models were used to estimate beta values (β) or odds ratio (OR), respectively, and 95% confidence intervals (95% CIs) in case-control models with MS case status as the predictor, and case-only models. The outcome was the TICS-M score and six subscores. Additional covariates were: year of birth, sex, history of smoking and IM, self- and parental-education level, current and history of depression, immediate family history of MS, current BMI, vitamin D intake, and HLA-DRB1*15:01 status. Case-only models used the following predictors: MSSS and HLA-DRB1*15:01 carrier status. Case-only models also included age of onset, disease course, and DMT use as covariates. All variables were included initially; however, only variables that significantly affected outcome (predictor), after backward stepwise elimination (α-level=0.05), were retained in final adjusted models. STATA v13.1 (StataCorp, TX) was used for all analyses. Regression analyses were then repeated using stepwise elimination with both forward and backward selection for comparison; final models were based on Akaike information criterion25, and performed using the R package MASS26. A power analysis was carried out for both the case-control and case-only analyses27,28. The current study was well powered (Supplementary Table 1).
| Representative Comparisons | 80% power for β difference |
|---|---|
| Case-control | +/- 0.45 |
| Case-only: MSSS (continuous) | +/- 0.11 |
| Case-only: MSSS (binary) | +/- 0.70 |
| Case-only: Sex (male/female) | +/- 0.80 |
| Case-only: Infectious mononucleosis (yes/no) | +/- 0.70 |
| Case-only: History of depression (yes/no) | +/- 0.65 |
| Case-only: HLA-DRB1*15:01carrier (yes/no) | +/- 0.65 |
| Case-only: History of smoking (yes/no) | +/- 0.65 |
Supplementary Table 1: Power Analysis for Detecting β difference for the TICS-M score
The power needed to detect marginal associations for the case-control and case-only analyses was determined as previously described27,28. We assumed a two-sided type 1 error rate of 5% (α=0.05), as these analyses were not hypothesis free, but strongly hypothesis driven. Representative comparison examples based on the study sample are shown above. Binary exposures ranged from a frequency of 20-50%. 80% power was present to detect β differences for the TICS-M score as indicated. Therefore, the results and interpretations are in accordance with these established criteria. We were well-powered to detect differences for the majority of comparisons in the current study.
Results
MS cases were more likely to have smoked, have a history of IM, report a family history of MS, have current depression, have a higher self-perceived cognitive deficits (PDQ) score, and to have an increased carrier frequency of HLA-DRB1*15:01 compared to controls, as expected (Table 1). The TICS-M scores ranged from 8-36, and were normally distributed in cases and controls (Supplementary Figure 1).
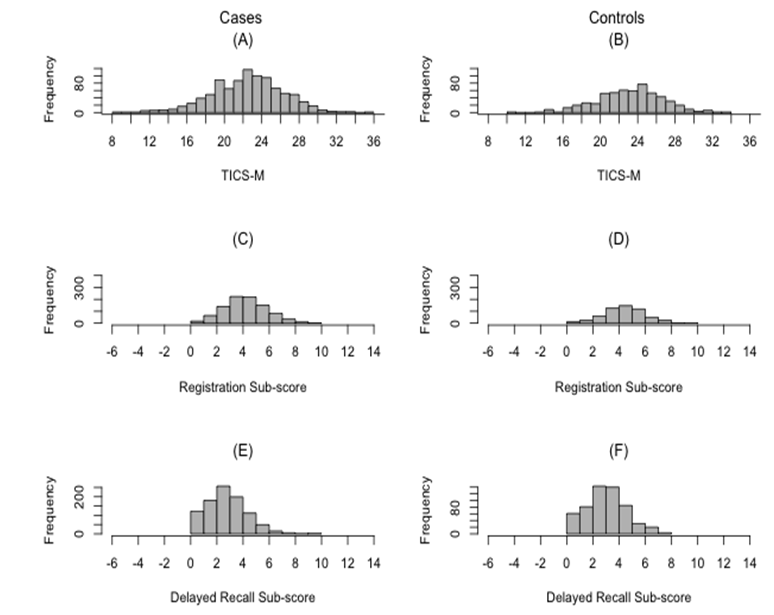
Supplementary Figure 1: Distribution of TICS-M Scores and TICS-M Subscores in Cases and Controls.
(A) Distribution of the TICS-M scores in cases; (B) Distribution of the TICS-M scores in controls; (C) Distribution of registration subscore in cases; (D) Distribution of registration subscore in controls; (E) Distribution of delayed recall subscore in cases; and (F) Distribution of delayed recall subscore in controls.
We compared KPNC study participants who completed the TICS-M assessment with those who did not, for association with case status, sex, PDQ score, history of smoking, age, education and depression at study entry. We examined both the individuals in the current study with complete genetic, clinical and environmental exposure data (n=1,700; our original study sample) and our larger population sample that included an additional 964 individuals without complete genetic data at the time of study (total n=2,664). Cases, female participants and individuals with no (or who had parents with no) college degree were more likely to refuse the TICS-M than controls, male participants, and individuals with (and/or had parents with) a college degree (all p<0.001, Table 2). Age at study entry did not influence participant TICS-M refusal. Further, significant differences were not observed for PDQ scores between cases who completed the TICS-M and cases who did not, and similar results were shown for controls, even after adjustment for age and sex (p > 0.20, data not shown). Finally, among MS cases, the PDQ score was significantly associated with TICS-M score (β =-0.14, p=8.9 x 10⁻⁷), controlling for sex, current depression, MSSS, parental college status, and age at onset. Among controls, the PDQ score was also significantly with TICS-M (β =-0.16, p=6.6 x 10⁻¹²), controlling for sex, current depression, age and parental college status. In both of these models, worse perceived cognitive deficits were associated with worse performance on the TICS-M.
| Participants |
TICS-M Test Participant Yes (%) |
TICS-M Test Participant No (%) |
P-value |
|---|---|---|---|
| MS cases | 86% | 14% | |
| MS controls | 93% | 7% | p<0.001 |
| Male | 95% | 5% | |
| Female | 88% | 12% | p<0.001 |
| Smoked ever | 89% | 11% | |
| Smoked never | 90% | 10% | p=0.63 |
| Age at study entry | 51 (+/-8.8) | 52 (+/-8.5) | p=0.14 |
| College | 90% | 10% | |
| No College | 84% | 16% | p<0.001 |
| Father college | 92% | 8% | |
| No Father College | 88% | 12% | p<0.001 |
| Mother college | 91% | 9% | |
| No Mother college | 88% | 12% | p<0.05 |
| Currently depressed | 87% | 13% | |
| Not currently depressed | 90% | 10% | p=0.33 |
Table 2: Association between TICS-M Refusal and Key Characteristics
A chi-square test or t-test was used to determine whether the variable distribution differed significantly (p<0.05) between the two groups. Results are based on sample of 2,664 individuals; they are very similar to results for the final sample in the current study (n=1,700) (See text for details)
In the case-only analysis, year of birth, history of smoking, parental-education, current depression, disease course, and MSSS were significantly associated with the TICS-M score when each variable was considered in univariate analysis (p<0.05, data not shown). The strongest association was observed for sex (β=-1.46, p=<0.001, data not shown). On average, male MS cases had lower cognitive scores compared to female cases. Similarly, cases who were older, who were smokers, whose parents had a lower level of education, who were currently depressed, or who had a more progressive/unknown disease course at onset demonstrated lower cognitive scores. MS cases with more severe disease, as measured by MSSS, had a lower TICS-M score, even after controlling for these covariates (Table 3). Notably, individuals with very severe MS (MSSS ≥7.5) had a lower TICS-M score compared to those with a benign presentation (MSSS <2.5) after adjustment (β=-1.12, p=0.005). Similar results were observed whether MSSS was considered as a continuous or binary variable. The strong association between sex and TICS-M persisted in all MSSS models (βContinuous=-1.32, p<0.001; βBinary=-1.33, p<0.001; βExtreme=-1.40, p<0.001); males had a lower TICS-M score compared to females, even after accounting for disease severity (Table 3). Consistent associations were also observed between an older age of onset, lower parental-education, disease course and a lower TICS-M score. No evidence for association between HLA-DRB1*15:01 and cognitive status was observed in cases (data not shown).
| Variable | Model 1 (Continuous) | Model 2 (Binary) | Model 3 (Extreme) | |||
|---|---|---|---|---|---|---|
| β (95% CI) | p-value | β (95% CI) | p-value | β (95% CI) | p-value | |
| MSSS Continuous | -0.18 (-0.3, -0.1) | <0.001 | -- | -- | -- | -- |
| MSSS Binary | -- | -- | -1.26 (-1.9, -0.7) | <0.001 | -- | -- |
| MSSS Extreme | -- | -- | -- | -- | -1.12 (-1.9, -0.4) | 0.005 |
| Sex (Male) | -1.32 (-1.9, -0.7) | <0.001 | -1.33 (-1.9, -0.8) | <0.001 | -1.40 (-2.2, -0.6) | <0.001 |
| Age of onset | 0.03 (0.01, 0.1) | 0.01 | 0.03 (0.003, 0.1) | 0.03 | -- | -- |
| Parental-educationt | -0.36 (-0.5, -0.2) | <0.001 | -0.34 (-0.5, -0.2) | <0.001 | -0.38 (-0.6, -0.2) | 0.001 |
| Disease course | -0.78 (-1.4, 0.1) | 0.02 | -0.73 (-1.4, -0.1) | 0.03 | -- | -- |
Table 3: Association Between Clinical and Demographic Factors and Cognitive Status based on the TICS-M in MS Cases
MSSS was considered as continuous (Model 1), or dichotomous (Model 2 and Model 3); backward elimination was used to retain variables in the final models, see Methods for details. Variables in the primary model were coded as: sex (0=female), age of onset (years), parental-education (0=doctoral degree to 7=less than high school), and disease course (0=RRMS and SPMS, 1=PPMS, PRMS or unknown).
These results suggest that, on average, men with MS have a lower cognitive score assessed with the TICS-M than women with MS; individuals with a later age of onset of MS had a higher cognitive score; individuals with MS who had parents with less education had a lower cognitive score than individuals with MS who had parents with more education; Individuals with PPMS, PRMS or unknown disease course had a lower cognitive score than those with RRMS or SPMS.
The TICS-M score also differed significantly between MS cases and controls (Table 1); this association persisted in multivariable regression models (Table 4A and 4B). On average, the TICS-M score was lower in cases than controls (mean difference of -0.60, p=0.001) (Table 1); results were consistent with models adjusted for current depression, history of depression, year of birth, sex, smoking and parental-education (β=-0.53, p=0.007) (Table 4A). Further, when cases with disease duration less than five years were compared to controls, the association persisted (data not shown). Significant differences were detected between cases and controls when the TICS-M was measured as orientation, registration, and delayed-recall (Table 4B), though power for subscore analysis was limited. When stepwise regression with both forward and background elimination were used, there was some occasional differences in which variables were included in the models, but the main findings remained the same.
| Model | β | 95% CI | p-value |
|---|---|---|---|
| Case status | -0.53 | (-0.9, -0.1) | 0.007 |
| Current depression | -0.95 | (-1.6, -0.3) | 0.006 |
| History of depression | 0.01 | (0.003, 0.01) | 0.001 |
| Year of birth | 0.03 | (0.01, 0.1) | 0.004 |
| Male | -0.95 | (-1.4, -0.5) | <0.001 |
| Smoking | -0.46 | (-0.8, -0.1) | 0.016 |
| Parental-education | -0.15 | (-0.3, -0.01) | 0.033 |
Table 4A: The TICS-M score in MS Cases and Controls
This primary model uses case status as a predictor for the TICS-M score. On average, MS cases had a -0.53 lower score than controls after adjustment. The difference from the primary model persisted when restricting to MS cases with less than five years of disease duration as compared to controls (data not shown). Backward elimination was used to retain variables in the final models, see Methods for details. Variables in the primary model were coded as: case-control status (0=control), current depression (0=not depressed), history of depression (0=never depressed), year of birth (years), sex (0=female), smoking (0=never smoked), parental-education (0=doctoral degree to 7=less than high school).
| Model | β | 95% CI | p-value |
|---|---|---|---|
| Orientation | -0.23 | (-0.30, -0.10) | <0.001 |
| Registration | -0.17 | (-0.30, 0.003) | 0.046 |
| Calculation | 0.02 | (-0.10, 0.20) | 0.78 |
| Comprehension | -0.02 | (-0.04, 0.01) | 0.14 |
| Language | -0.01 | (-0.03, 0.02) | 0.44 |
| Delayed recall | -0.20 | (-0.40, -0.03) | 0.02 |
Table 4B: The TICS-M Subscores in MS Cases and Controls
Statistically significant subscores were orientation, registration, and delayed-recall. Models were adjusted for: current and history of depression, year of birth, sex, smoking, self- and parental-education. Self-education was added in the sub-score models because there was no correction made for the sub-scores. Self-education was coded as: 0=doctoral degree to 7=less than high school.
Discussion
Cognitive impairment is common in MS and related to multiple facets of cerebral pathology. Traditional professionally administered psychometric tests are not practical or affordable in large epidemiologic studies. The goal of this study was to determine whether MS patients (and controls) would participate in remote studies involving cognitive assessment, and to determine which characteristics distinguished participants and non-participants. We identified factors that influenced study participation rates. We investigated the relationship between MS risk factors and TICS-M score in cases, and score differences between cases and controls. Our results indicate for the first time, that a remotely administered cognitive assessment is quite feasible for conducting large epidemiologic studies in MS, and lay the much needed foundation for future work in this area that utilizes remote MS-validated cognitive testing.
The TICS-M is a telephone administered test previously validated as a screen for aging related diseases such as mild cognitive impairment and Alzheimer Disease11. Scores derived in the current study were significantly correlated with self-perceived cognitive deficits collected through self-report for each participant using the PDQ at the same time the objective TICS-M was performed, controlling for sex, current depression and parental education. On average, the TICS-M score was significantly lower in MS cases when compared to controls, even after accounting for age, sex, education, depression and smoking status15. Importantly, findings persisted when cases were restricted to those with disease duration of less than five years, suggesting that the TICS-M might be sensitive for patients early in the disease course with cognitive impairment. The TICS-M score was also significantly associated with the PDQ score, controlling for sex, current depression and parental education.
The TICS-M score was inversely associated with physical disability (MSSS) in MS cases. (Pearson’s correlation coefficient r = -0.158). As physical disability increased, so did evidence for cognitive impairment (Table 3). Several clinical variables were also associated with the TICS-M score in cases, including sex, age of onset, parental-education, smoking and disease course; results are in strong agreement with previous studies using in-person, MS-validated neuropsychological tests2. Male cases, on average, had lower scores than females. Notably, sex was not associated with the TICS-M score in controls (data not shown). Previously published work suggests males with MS have more severe disease progression29; our results provide further evidence that disease mechanisms contributing to cognitive health in MS may also differ by sex.
There is a strong genetic contribution to MS; the human leukocyte antigen (HLA)-DRB1 locus within the major histocompatibility complex (MHC), specifically the DRB1*15:01 allele, confers the strongest risk30. TICS-M scores did not vary by HLA-DRB1*15:01 carrier status in MS cases; no association was observed. Results are similar to those based on in-person MS-validated neuropsychological testing31. Several additional and independent MHC risk variants also contribute to MS susceptibility30. Additional work is needed to exclude a relationship between MHC genes and cognitive dysfunction in MS. Recent genome-wide association studies (GWAS) and targeted candidate gene approaches have identified 110 non-MHC risk variants for MS23,32. Environmental factors also confer risk of developing MS, including childhood/adolescent obesity, low levels of vitamin D, and exposure to cigarette smoke33. The genetic and environmental influences on MS associated cognitive impairment are largely unknown.
This study demonstrates that almost all MS cases and controls who were invited to undergo telephone-administered cognitive testing agreed to participate. Our analyses suggest that cases, female participants and individuals (or individuals with parents) with no college degree were more likely to refuse assessment with the TICS-M. Future studies can implement strategies to help encourage females with MS to participate. Importantly, among cases who completed the TICS-M assessment versus those that did not, no significant differences were observed for PDQ scores, suggesting self-reported cognitive status is not a strong predictor of whether a MS case might participate in remote cognitive assessment. Similar results were shown for controls. Though the difference in TICS-M score between cases and controls was small, this study provides evidence that cases and controls do perform differently and that, more importantly, MS cases are indeed willing to participate in remote cognitive assessment. While the TICS-M has not yet been validated for MS, it is a validated tool for cognitive assessment and is similar to the California Verbal Learning Test-II34 which has been previously validated for MS35.
The current study had several strengths. We investigated the largest sample of MS cases and controls, to date, for a measure of cognitive impairment, and using remote assessment. Further, both cases and controls were drawn from the same population (KPNC) and are well characterized. Prevalent cases were studied, including those with very recent symptom onset. Distribution of disease course, as indicated by clinical histories, shows our case sample was representative of other established cohorts; for example, our sample was higher in proportion for females, ~80% of cases were relapsing-remitting at onset19, and expected associations with established genetic and environmental risk factors were observed. Importantly, we controlled for potential confounders such as DMT use. Further, two variables captured history of depression and current depression at time of TICS-M administration; both can affect cognitive performance15 and were included in models. Additionally, accounting also for other covariates such as sex and parental-education that were associated with the TICS-M score, indicates the observed difference between cases and controls is likely due to cognitive impairment, as measured by TICS-M. Self-education, which differed at baseline between cases and controls (Table 1), can impact the TICS-M score. Scores were therefore corrected prior to analysis21. Results based on the TICS-M score were consistent with results for self-perceived cognitive deficits score measured with the PDQ16.
While we are encouraged by these findings, this work falls short of establishing the reliability and validity of the TICS-M in MS. The psychometric standards necessary for validation are well known36, and this study did not examine test-retest reliability, sensitivity compared to conventional testing, or convergent validity. We acknowledge that the TICS-M emphasizes verbal memory and language, domains that are more relevant for mild cognitive impairment and Alzheimer Disease, and, are a better match for a telephone-based assessment. Furthermore, assessment of visual-related cognitive deficits cannot be assessed with the TICS-M and processing speed is not measured. However, the TICS-M has been utilized successfully in randomized controlled trials and large-scale population studies37,38 and we are presently pursuing similar approaches for the MS community using the Brief International Cognitive Assessment for MS36 as a base for this assessment. Pilot work39 suggests that a telemedicine approach to the symbol digit modalities test is feasible, although the optimal format and test form is yet to be determined. Other pilot work suggests that remotely-delivered cognitive remediation is feasible for individuals with MS40. Further, our study participants did not refuse testing for depression which must be measured at the time of any cognitive assessment in MS. This finding also supports the feasibility of remote cognitive testing.
Our study was restricted to white non-Hispanic KPNC members; thus, potentially limiting generalizability to non-white populations. The case-only analysis of cognitive impairment described here was partly cross-sectional, as the MSSS and the TICS-M score were both assessed at study entry; therefore, it is not possible to establish temporality between disease severity and cognitive status. However, this was not true for other variables, such as sex and genotype. Several other risk factors that can affect cognitive impairment, such as use of alcohol, disease comorbidities, and treatments for symptom management were not studied. Because socioeconomic status (SES) has been shown to be associated with MS14, differences in TICS-M participation based on this variable has the potential to induce a selection bias in the study. Lower SES (using parental-education as a proxy) was associated with refusal to complete the TICS-M. Therefore, association between the TICS-M score and case status is expected to be biased towards the null, meaning the true association may be stronger than what was observed. Controlling for parental-education in our case-control models was necessary, due to the association between this variable and cognitive impairment. Because the TICS-M score is corrected for self-education prior to analysis, the potential for selection bias or confounding was addressed. Given that females were more likely to refuse the TICS-M, the true association between sex and the TICS-M score could be biased towards the null, since males were more likely to experience greater cognitive impairment.
In summary, our results suggest a remotely administered cognitive assessment is feasible for future large studies. Non-participants in telephone-administered cognitive assessment were more likely to be an MS case, female and have lower educational status. Male sex, history of smoking and a more progressive disease course were associated with lower TICS-M scores in cases; these findings are in strong agreement with previous reports based on in-person, MS-validated neuropsychological tests. Early identification of cognitive dysfunction through screening and full characterization of clinical, environmental, and genetic predictors of poor cognitive health outcomes will have benefits in clinical settings through intervention2 and ultimately prevention; much larger studies are needed that utilize MS-validated cognitive assessments.
Acknowledgments
This work was supported by the NIH/NINDS R01NS049510; NIH/NIAID R01AI076544; NIH/NIEHS R01 ES017080. We thank Hong Quach, Ling Shen and Emon Elboudwarej for their assistance with this manuscript.
Author Contributions
Conception or design of the work (MFG, CBH, LFB, CS, RAW); Data collection (CS, XS, LFB, KHB); Data analysis and interpretation (MFG, CBH, XS, FBSB, LFB, RAW, CS, RHBB); Drafting the article (MFG, CBH, LFB, RHBB); Critical revision of the article (CBH, LFB, RHBB, CS, FBSB); Final approval of the version to be published (MFG, CBH, FBSB, XS, KHB, RAW, CS, RHHB, LFB).
References:
- Langdon DW. Cognition in multiple sclerosis. Curr Opin Neurol 2011; 24: 244–249.
- Benedict RHB, Zivadinov R. Risk factors for and management of cognitive dysfunction in multiple sclerosis. Nat Rev Neurol 2011; 7: 332–342.
- Chiaravalloti ND, DeLuca J. Cognitive impairment in multiple sclerosis. Lancet Neurol 2008; 7: 1139–1151.
- Rao SM, Leo GJ, Ellington L, et al. Cognitive dysfunction in multiple sclerosis. II. Impact on employment and social functioning. Neurology 1991; 41: 692–696.
- Beatty WW, Blanco CR, Wilbanks SL, et al. Demographic, Clinical, and Cognitive Characteristics of Multiple Sclerosis Patients Who Continue to Work. Neurorehabilitation and Neural Repair 1995; 9: 167–173.
- Morrow SA, Drake A, Zivadinov R, et al. Predicting loss of employment over three years in multiple sclerosis: clinically meaningful cognitive decline. Clin Neuropsychol 2010; 24: 1131–1145.
- Benedict RHB, Wahlig E, Bakshi R, et al. Predicting quality of life in multiple sclerosis: Accounting for physical disability, fatigue, cognition, mood disorder, personality, and behavior change. J Neurol Sci 2005; 231: 29–34.
- Patti F, Amato MP, Trojano M, et al. Cognitive impairment and its relation with disease measures in mildly disabled patients with relapsing-remitting multiple sclerosis: baseline results from the Cognitive Impairment in Multiple Sclerosis (COGIMUS) study. Mult Scler 2009; 15: 779–788.
- Kalmar JH, Gaudino EA, Moore NB, et al. The relationship between cognitive deficits and everyday functional activities in multiple sclerosis. Neuropsychology 2008; 22: 442–449
- Seo EH, Lee DY, Kim SG, et al. Validity of the telephone interview for cognitive status (TICS) and modified TICS (TICSm) for mild cognitive imparment (MCI) and dementia screening. Arch Gerontol Geriatr 2011; 52.
- de Jager CA, Budge MM, Clarke R. Utility of TICS-M for the assessment of cognitive function in older adults. Int J Geriatr Psychiatry 2003; 18: 318–324.
- Krieger N. Overcoming the absence of socioeconomic data in medical records: Validation and application of a census-based methodology. In: American Journal of Public Health. 1992, pp. 703–710.
- Polman CH, Reingold SC, Banwell B, et al. Diagnostic criteria for multiple sclerosis: 2010 revisions to the McDonald criteria. Ann Neurol 2011; 69: 292–302.
- Briggs FBS, Acuña BS, Shen L, et al. Adverse socioeconomic position during the life course is associated with multiple sclerosis. J Epidemiol Community Health 2014.
- Dennett K, Tometich D, Duff K. Demographic corrections for the modified telephone interview for cognitive status. Clin Neuropsychol 2013; 27: 1121–1130.
- Sullivan MJ, Edgley K, Dehoux E. A survey of multiple sclerosis: I. Perceived cognitive problems and compensatory strategy use. Can J Rehabil 1990; 4: 99–105.
- Roxburgh RH, Seaman SR, Masterman T, et al. Multiple Sclerosis Severity Score: using disability and disease duration to rate disease severity. Neurology 2005; 64: 1144–1151.
- Goodin DS. A questionnaire to assess neurological impairment in multiple sclerosis. Mult Scler 1998; 4: 444–451.
- IMSGC. Genome-wide association study of severity in multiple sclerosis. Genes Immun 2011; 12: 615–625.
- Brandt J, Welsh K a, Breitner JC, et al. Hereditary influences on cognitive functioning in older men. A study of 4000 twin pairs. Arch Neurol 1993; 50: 599–603.
- Knopman DS, Roberts RO, Geda YE, et al. Validation of the telephone interview for cognitive status-modified in subjects with normal cognition, mild cognitive impairment, or dementia. Neuroepidemiology 2010; 34: 34–42.
- Howie BN, Donnelly P, Marchini J. A flexible and accurate genotype imputation method for the next generation of genome-wide association studies. PLoS Genet. 2009;5(6). doi:10.1371/journal.pgen.1000529.
- Barcellos LF, Sawcer S, Ramsay PP, et al. Heterogeneity at the HLA-DRB1 locus and risk for multiple sclerosis. Hum Mol Genet 2006; 15: 2813–2824.
- Purcell S, Neale B, Todd-Brown K, et al. PLINK: a tool set for whole-genome association and population-based linkage analyses. Am J Hum Genet 2007; 81: 559–575.
- Harrell F. Regression modeling strategies: with applications to linear models, logistic and ordinal regression, and survival analysis. Springer, 2015.
- Venables WN, Ripley BD. Modern Applied Statistics with S. Issues of Accuracy and Scale 2002; 868.
- Gauderman WJ. Sample size requirements for matched case-control studies of gene-environment interaction. Stat Med 2002; 21: 35–50.
- Gauderman WJ. Candidate Gene Association Analysis for a Quantitative Trait, Using Parent-Offspring Trios. Genet Epidemiol 2003; 25: 327–338.
- Glad SB, Nyland HI, Aarseth JH, et al. Long-term follow-up of benign multiple sclerosis in Hordaland County, Western Norway. Mult Scler 2009; 15: 942–950.
- Patsopoulos NA, Barcellos LF, Hintzen RQ, et al. Fine-Mapping the Genetic Association of the Major Histocompatibility Complex in Multiple Sclerosis: HLA and Non-HLA Effects. PLoS Genet 2013; 9:e1003926.
- Jensen CJ, Stankovich J, Van der Walt A, et al. Multiple sclerosis susceptibility-associated SNPs do not influence disease severity measures in a cohort of Australian MS patients. PLoS One 2010; 5.
- Beecham AH, Patsopoulos NA, Xifara DK, et al. Analysis of immune-related loci identifies 48 new susceptibility variants for multiple sclerosis. Nat Genet 2013.
- Ascherio A. Environmental factors in multiple sclerosis. Expert Rev Neurother 2013; 13: 3–9.
- Delis DC, Kramer JH, Kaplan E, et al. California Verbal Learning Test – second edition. Adult version. Manual. 2000.
- Stegen S, Stepanov I, Cookfair D, et al. Validity of the California Verbal Learning Test-II in multiple sclerosis. Clin Neuropsychol 2010; 24: 189–202.
- Benedict RH, Amato M, Boringa J, et al. Brief International Cognitive Assessment for MS (BICAMS): international standards for validation. BMC Neurology 2012; 12: 55.
- Walker JG, Batterham PJ, Mackinnon AJ, et al. Oral folic acid and vitamin B-12 supplementation to prevent cognitive decline in community-dwelling older adults with depressive symptoms--the Beyond Ageing Project: a randomized controlled trial. Am J Clin Nutr 2012; 95: 194–203.
- Lacruz M, Emeny R, Bickel H, et al. Feasibility, internal consistency and covariates of TICS-m (telephone interview for cognitive status-modified) in a population-based sample: findings from the KORA-Age study. Int J Geriatr Psychiatry 2013; 28: 971–978.
- Settle JR, Robinson S a., Kane R, et al. Remote cognitive assessments for patients with multiple sclerosis: a feasibility study. Mult Scler J 2015; 21: 1072–1079.
- Charvet LE, Shaw MT, Haider L, et al. Remotely-delivered cognitive remediation in multiple sclerosis (MS): protocol and results from a pilot study. Mult Scler Journal–Experimental, Transl Clin 2015; 1: 2055217315609629.