
The Effects of Arginine Vasopressin and Acetazolamide on CNS Clearance of Acetaminophen and Ibuprofen in Rats
Qin Wang, Richard Grater*, Luisette Delva, Elvana Veizaj, Cheryl Black, Chris Rowbottom, Roger Rusesabagina, Ellen Rohde, Patricia Schroeder, Tonika Bohnert, Guangqing Xiao
Preclinical Pharmacokinetics and In Vitro ADME, Biogen Inc. 225 Binney St Cambridge, MA 02142, USA
Abstract
Objective: The convective flow of CSF plays a crucial role for CNS to clear endogenous and xenobiotic substances. The objective of this study is to investigate the impact of modifying CSF flow with acetazolamide and arginine vasopressin (AVP) on the CNS clearance of ibuprofen and acetaminophen.
Results: Microdialysis studies indicated that acetaminophen AUC ratio (Kp,uu) between brain ISF and unbound plasma increased from 0.40 ± 0.14 in the vehicle control group to 0.60 ± 0.27 in the acetazolamide treated group (P < 0.05). Conversely, acetaminophen’s steady-state ISFC to unbound_plasmaC ratio (Kp,uu) decreased from 0.44 ± 0.08 to 0.36 ± 0.07 upon IV infusion of 0.3 µg/hr AVP (P < 0.05). Using CSF concentration as a surrogate of unbound brain drug concentration, AVP treatment reduced the CSFAUC0-5hr/unbound_plasmaAUC0-5hr ratio from 1.63 to 0.85 for acetaminophen, and the CSFC4hr / unbound_plasmaC4hr ratio decreased from 0.91 ± 0.27 to 0.54 ± 0.12 for ibuprofen (P < 0.05).
Conclusion: We have demonstrated that acetazolamide decreases the CNS clearance of acetaminophen, while AVP increases the CNS clearance of both acetaminophen and ibuprofen. Such changes are caused by altering the CSF production rates.
Introduction
There are numerous studies on the challenges of delivering medications into the central nervous system (CNS). However, there are not many studies on the mechanisms of CNS clearance of waste and factors that affect the process. In this study, we investigated the effects of modulating of cerebrospinal fluid (CSF) production on CNS clearances of acetaminophen and ibuprofen in rats.
The concept of Kp,uu was introduced by Hammarlund-Udenaes and others to describe the uptake extent of solutes in the brain1. It is defined as the ratio of steady-state unbound drug concentration between various CNS compartments (such as CSF or brain tissues) to the systemic circulation. To enter CNS, solutes need to cross either the blood brain barrier (BBB) and/or blood cerebrospinal fluid barrier (BCSFB). With a few exceptions of active uptake, solutes enter CNS largely by passive diffusion. Without the consumption of energy, the passive diffusion goes only in the direction from high to low concentration (Fick’s Law), i.e., unbound_plasmaC > unbound_CNSC or Kp,uu < 1. Upon entering the CNS, there are a total of four possible clearance mechanisms: 1) to diffuse back to systemic circulation across the BBB and/or BCSFB: the reversal of the direction of passive diffusion also obeys Fick’s law and occurs only when unbound_CNSC > unbound_plasmaC or Kp,uu < 1. 2) to be actively pumped out of the CNS by efflux transporters expressed on the membranes of BBB and/or BCSFB: this process is capable of clearing compounds from the CNS against the concentration gradient when energy-requiring mechanisms are involved. 3) to be metabolized within CNS: it is worth noting that the brain is not an organ for extensive metabolism2. 4) Convection carried by brain interstitial and cerebrospinal fluid (ISF/CSF) flow and drainage.
For mass balance at steady-state, solute concentration in the CNS is determined by the rate of entering the CNS divided by the sum of all possible clearance mechanisms out of the same compartment. To simplify the analysis, we treated brain tissue and CSF as one fast equilibrated homogeneous compartment as shown in Eq 1 discussed previously3:
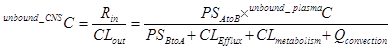
Eq 1
Where Rin is the rate of passage into the CNS as the amount per time, and CLout is the total clearance out of the CNS as volume per time. The unbound_CNSC and unbound_plasmaC denote the steady-state unbound drug concentration in CNS and systemic circulation, respectively. PSAtoB and PSBtoA represent directional first order kinetics across BBB4. The Clefflux, Clmetabolism, and Qconvection represent individual clearance mechanisms as indicated by their correspondent subscripts. By rearranging equation 1, one has equation 2 for Kp,uu (Eq 2)
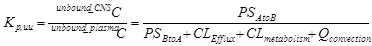
Eq 2
CNS uptake of acetaminophen and ibuprofen have been well characterized5-7. Acetaminophen and ibuprofen were selected because they are both highly BBB permeable and neither subject to transporter-mediated efflux or extensive metabolism in the brain. Acetazolamide decreases CSF production8. Arginine vasopressin (AVP), on the other hand, increases CSF production9, 10. Both AVP and acetazolamide have been used in the clinic for many years. Other than altering ISF/CSF production, there has been no report of either AVP or acetazolamide compromising the BBB integrity/permeability. If one assumes that acetazolamide and AVP have no effect on BBB permeability (PSAtoB, PSBtoA, CLEfflux), nor CLmetabolism for either acetaminophen or ibuprofen at the CNS level, we have the following possibilities: in the presence of acetazolamide, the production of ISF/CSF decreases which resulted in an increase of the Kp,uu and, in the presence of AVP, the production of ISF/CSF increases which resulted in a decrease of the Kp,uu as shown in Eq 3.

Eq 3
Material and Methods
Material. Acetaminophen, ibuprofen, acetazolamide, and AVP were purchased from Sigma-Aldrich with purities greater than 99% (Sigma-Aldrich, St Louis, MO). Microdialysis perfusion fluid (147 mM NaCl, 2.7 mM KCl, 1.2 mM CaCl2, 0.85 mM MgCl2) was prepared in house. The perfusion fluid was filtered through a 0.22 µm sterile filter immediately prior to use. The dose solutions of acetaminophen and acetazolamide for oral administration were formulated in water containing 0.5% methylcellulose (w/v) and 0.1% polysorbate 80 (v/v). Formulations for the intravenous (IV) infusion were in saline. The BR-2 microdialysis probe had an outer diameter of 320 µm and was 2 mm long with a molecular weight cutoff of 30 kDa (BASi, West Lafayette, IN).
In vitro studies
Plasma protein binding of acetaminophen and ibuprofen was determined using equilibrium dialysis at 37ºC for 4 hours with a 5% CO2 environment. Rapid Equilibrium Dialysis (RED) device with 8 kDa molecular weight cut-off dialysis membrane was used (Thermo Fisher Scientific, 300 Industry Drive, Pittsburgh, PA). The spiked nominal plasma concentrations of acetaminophen and ibuprofen were 0.1, 1.0 and 10 µg/mL in the presence or absence of 1µg/mL of acetazolamide or 1 ng/mL of AVP.
The intrinsic permeability of acetaminophen and ibuprofen was evaluated using an isolated clone of MDCKII cells (American Tissue Culture Collection, ATCC, 10801 University Boulevard, Manassas, VA) which was optimized for low active efflux of P-glycoprotein and BCRP and consistent monolayer growth and confluency. The bi-directional assay was performed in 96-well plates (Corning catalog 3392, 1 Riverfront Plaza, Corning, NY) and incubated at 37ºC for 2 hours. The donor wells consisted of 1 µg/mL of acetaminophen or ibuprofen with and without 1 µg/mL acetazolamide or 1 ng/mL AVP, or vehicle in 1 × HBSS buffer containing HEPES. The receiver wells contained 1 × HBSS buffer containing HEPES and 1% bovine serum albumin.
In vivo studies
Animals. The jugular arterial and venous dual catheterized adult male Sprague-Dawley rats (270 - 350 g) were obtained from Charles River Laboratories (Wilmington, MA). The intracisternal cannulated rats for CSF collection were obtained from Charles River Laboratories (Morrisville, NC). Upon arrival, animals were housed individually for 2 - 14 days under standard environmental conditions (ambient temperature 21 - 24°C, humidity 60%, and a 12/12-hour light/dark cycle), with free access to standard laboratory chow food and filtered water. All studies and surgical procedures were approved and monitored by the Institutional Animal Care and Use Committees (IACUC) of Biogen and Charles River Laboratories.
Microdialysis. The position of BR-2 microdialysis guide (BASi, West Lafayette, IN) relative to the bregma was 3.2 mm anterior-posterior, 1.2 mm lateral-medial and -2.0 mm lateral dorsal ventral based on the stereotaxic co-ordinates (David Kopf Instruments, Tujunga, CA). The animals were individually housed for 3 - 5 days after the probe guide placement surgery to allow for full recovery prior to the microdialysis experiment.
The effect of acetazolamide on brain exposures of acetaminophen. Animals were randomly divided into acetazolamide treated versus vehicle control groups. On day 1, the animals were individually placed into Culex cages (BASi, West Lafayette, IN). The microdialysis probe dummy was replaced with a microdialysis probe and connected with FEP tubing. The animals acclimated overnight and underwent microdialysis perfusion with artificial CSF at 0.5 µL/min, to ensure the recovery of BBB after probe implantation. The jugular arterial cannula was connected to the Culex autosampler for automated blood sampling over the course of the study. A microdialysis perfusion rate of 0.5 µL/min was maintained throughout the entire course of the study. On day 2, animals received an oral gavage of either 50 mg/kg of acetazolamide or vehicle dose followed by acetaminophen (50 mg/kg, oral gavage at 5 mL/kg) 30 minutes later. The microdialysis collection clock was started 45 minutes prior to acetaminophen administration. The time delay from the probe to the sample collection vials was based on the tubing void volume and the perfusion rate of 0.5 µL/min. Blood was sampled at 0 (pre-dose), 0.17, 0.5, 1, 2, 5, 8, 12 and 24 hours post acetaminophen dose administration. Microdialysate samples were collected into refrigerated glass vials mounted in the Culex fraction collector at 0 – 4ºC at 60 min intervals. Calibration of microdialysis probe recovery was by retro-dialysis [6].
Crossover study to assess the effect of AVP on brain exposures of acetaminophen. The secretion of AVP follows the circadian rhythm, therefore, it was essential to have the sample collection within the same period of time. In this cross-over study during both AVP treated and vehicle control phases, the microdialysis and plasma samples were collected during the daylight period between 10:00 AM to 2:00 PM. During each treatment phase, 3 microdialysate and 3 plasma samples were collected to calculate the brain_ISFC and plasmaC averages. On day 1, animals were individually placed into the Culex auto-sampler cages. The perfusion was started through the microdialysis probe, overnight. At the same time, IV infusion of either acetaminophen plus AVP (treatment phase) or acetaminophen only (control phase) was started through the jugular vein catheter. The IV infusion formulation was 10 mg/mL of acetaminophen and 1.0 µg/mL of AVP in saline. The infusion rate was 0.3 mL/hr. The half-life of AVP and acetaminophen in rats is 10 - 20 minutes and 1 - 2 hour, respectively. A greater than 16-hour overnight infusion resulted in reaching a new steady-state or washout of residual dose for the crossover study design. After the last sample collection around 2:00 PM, animals received a continuous infusion of acetaminophen but switched the AVP treatment. The microdialysate and plasma samples were collected on day 3 for the second phase of the crossover study.
The effect of AVP on CSF exposures of acetaminophen. Intra-cisternal cannulated rats were used in this study. Briefly, rats received a subcutaneous (SC) administration of either 20 µg/kg of AVP or dose vehicle immediately followed by oral gavage of acetaminophen at 50 mg/kg. Plasma and CSF samples were stored at -80°C until analysis.
The effect of AVP on CSF concentration of ibuprofen. Jugular arterial and venous dual catheterized adult male Sprague-Dawley rats (270 - 350 g) were used in this study. The IV infusion formulation was 10 mg/mL of ibuprofen with or without 0.5 µg/mL of AVP in saline. The infusion rate was 1.0 mL/hr. Animals were sacrificed for blood and CSF (via cisterna magna puncture) after 4-hour infusion. CSF samples were visually inspected for appearance. Samples exhibiting a pinkish color, suggesting contamination of blood, were discarded. Plasma and CSF samples were stored at -80°C until analysis.
LC/MS-MS sample analysis. The internal standard used in the assays was 25 ng/mL 8-cyclopentyl-1,3-dipropylxanthine (CPDPX) obtained from Sigma-Aldrich (St. Louis, MO). The standard curves and sample preparations, plasma, CSF or brain homogenates, were by 1:4 (v/v) protein precipitation with 50/50 acetonitrile/methanol followed by centrifugation. Supernatants of 20 µL were injected onto the LC/MS-MS for analysis. The LC system was a LX2 multiplexing system Agilent 1200 pumps (Thermo Fisher Scientific, Waltham, MA) and CTC Pal autosampler with a Synergi 4µ Hydro-RP 50X2mm column (Phenomenex, Torrance, CA) used for separation. The mass spectrometer used was an API-5500 (Sciex, Framingham, MA). Electrospray ionization (ESI) positive ion mode was used for the detection of acetaminophen (and CPDPX) while negative ion mode was used for the detection of ibuprofen (and CPDPX). For both acetaminophen and ibuprofen, the lower limits of quantitation were 50 ng/mL for plasma, 10 ng/mL for CSF and microdialysis dialysate, respectively.
Data Analysis. Pharmacokinetic parameters were computed by non-compartmental analysis using Phoenix-WinNonlin 6.4. (Certara, Cary, NC). The area under the concentration-time curve (AUC) was calculated using the log-linear trapezoidal method. One tail t-test was used for statistical analysis assuming unequal variances.
Results
Unbound fraction and permeability of acetaminophen and ibuprofen: The free fractions of unbound acetaminophen and ibuprofen in rat plasma were determined as 38 ± 3% and 1.5 ± 0.5%, respectively. Neither acetazolamide nor AVP affected the plasma protein binding of acetaminophen and ibuprofen. The free fraction of 38% for acetaminophen and 1.5% for ibuprofen were used for correcting unbound plasma concentration in all studies. In the low efflux MDCKII cells, the addition of acetazolamide (1 μg/mL) or AVP (1 ng/mL) had no statistically significant impact on the intrinsic permeability of acetaminophen and ibuprofen at the concentrations tested (50, 500 and 5000 ng/mL) with average apparent permeability, Papp A-B, of 11.5 and 9.4 × 10⁻⁶ cm/s, respectively.
Effect of acetazolamide on brain exposures of acetaminophen. An average probe recovery for acetaminophen was 34.4 ± 18.3 % from 10 rats by retro-dialysis. The mean probe recovery of 34.4% was used for computing probe recovery of all microdialysis studies. The mean unbound plasma and brain ISF concentration-time curves were plotted in Figure 1a (control group, N = 7) and 1b (acetazolamide treated group, N = 11). The average acetaminophen brain_ISFAUC to unbound_plasmaAUC ratio (Kp,uu) increased from 0.40 ± 0.14 in acetaminophen only group to 0.60 ± 0.27 in acetazolamide (50 mg/kg oral gavage) treated group (one-way t-test, P < 0.05).
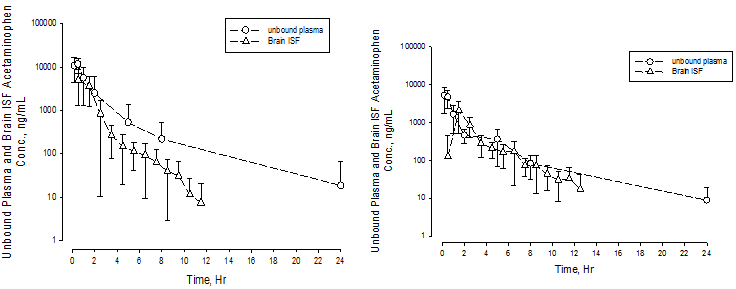
Figure 1: Unbound Plasma and Brain Concentration – Time Profiles of Acetaminophen in Rats with or without Concomitant Administration of Acetazolamide
1a Acetaminophen only
1b Acetaminophen with coadministration of acetazolamide (50 mg/kg)
Unbound plasma (open circle) and brain ISF (open triangle) concentration-time profiles of acetaminophen only (1a) and after concomitant administration with acetazolamide (1b).
Effect of AVP on brain concentration of acetaminophen. To evaluate the impact of AVP on brain exposures of acetaminophen, we have conducted a crossover IV (3 mg/hr) infusion microdialysis study in rats. The steady-state Kp,uu was calculated based on the average brain_ISFC and unbound_plasmaC concentrations of 3 observations from each rat between 10:00 AM to 2:00 PM. The average Kp,uu decreased from 0.44 ± 0.08 control phase to 0.36 ± 0.07 AVP (0.3 μg/hr treated phase (Table 1, one-way t-test, P < 0.05), a reduction of 18%.
Table 1. Unbound brain-to-plasma concentration ratio of acetaminophen in rats after overnight IV infusion of 3 mg/hr with or without AVP (0.3 µg/hr) (P < 0.05)
| Kp,uu (brain_ISFC / unbound_plasmaC) | ||
| Animal ID1,2 | AVP treatment phase | Control phase |
| 2Rat #1 | 0.35 | 0.45 |
| 1Rat #2 | 0.37 | 0.47 |
| 1Rat #3 | 0.38 | 0.48 |
| 1Rat #4 | 0.48 | 0.58 |
| 1Rat #5 | 0.38 | 0.45 |
| 2Rat #6 | 0.38 | 0.33 |
| 2Rat #7 | 0.22 | 0.31 |
| 2Rat #8 | 0.31 | 0.42 |
| Mean | 0.36 | 0.42 |
| Stdev | 0.07 | 0.08 |
1 AVP treatment phase first. 2 Control phase first
Effect of AVP on CSF exposures of acetaminophen and ibuprofen. CSF has been widely used as a surrogate for assessing CNS drug exposures11. Upon subcutaneous administration of 20 μg/kg of AVP and oral gavage of acetaminophen, the average acetaminophen CSFAUC0-5hr to unbound_plasmaAUC0-5hr ratio decreased from 163% in the vehicle control group to 85% in the AVP treated animals. Separately, at concomitant IV infusion of ibuprofen (10 mg/hr) with or without AVP (0.5 µg/hour), the average ibuprofen CSFC4h to unbound_plasmaC4h ratio decreased from 0.91 ± 0.27 in the vehicle control group to 0.54 ± 0.12 in the AVP treated animals (Table 2, P < 0.05).
Table 2. Effect of AVP (0.5 µg/hr) on CSFC4hr to unbound_plasmaC4hr ratio of ibuprofen (10 mg/hr) (t-test, P < 0.05)
| Test Article | Treatment | Animal ID | unbound_plasmaC4hr | CSFC4hr | Kp,uu |
| Ibuprofen | Control | Grp1-Rat#1 | 211 | 202 | 0.96 |
| Ibuprofen | Control | Grp1-Rat#2 | 218 | NS1 | NA2 |
| Ibuprofen | Control | Grp1-Rat#3 | 234 | 292 | 1.25 |
| Ibuprofen | Control | Grp1-Rat#4 | 239 | 234 | 0.98 |
| Ibuprofen | Control | Grp1-Rat#5 | 164 | 143 | 0.87 |
| Ibuprofen | Control | Grp1-Rat#6 | 224 | 114 | 0.51 |
| Average | 215 | 197 | 0.91 | ||
| Stdev | 27 | 71 | 0.27 | ||
| Ibuprofen | AVP 0.5 µg/hr | Grp2-Rat#1 | 378 | 220 | 0.58 |
| Ibuprofen | AVP 0.5 µg/hr | Grp2-Rat#2 | 319 | 153 | 0.48 |
| Ibuprofen | AVP 0.5 µg/hr | Grp2-Rat#3 | 154 | 115 | 0.75 |
| Ibuprofen | AVP 0.5 µg/hr | Grp2-Rat#4 | 250 | 114 | 0.46 |
| Ibuprofen | AVP 0.5 µg/hr | Grp2-Rat#5 | 292 | 116 | 0.40 |
| Ibuprofen | AVP 0.5 µg/hr | Grp2-Rat#6 | 263 | 146 | 0.56 |
| Average | 276 | 144 | 0.54 | ||
| Stdev | 75 | 41 | 0.12 |
1 No sample. 2 Not applicable.
Discussion
Both acetazolamide and AVP participate in renal reabsorption of water. At high dose levels, these two agents may change systemic clearances of other medications12-16. Used as tool compounds, this study focused on their effects on CNS clearance of solutes.
At the BBB, endothelial cells secrete water into the brain interstitial space forming brain ISF17-21. Located at the BCSFB, the choroid plexus (CP) secretes water into the ventricles forming CSF. Via Virchow-Robin space, the CSF also enters the brain parenchymal spaces where it meets and exchanges solutes with the brain ISF21-24. Moving away from the BBB and BCSFB, the brain ISF/CSF carries waste collected in brain interstitial spaces, drains and reabsorbs at multiple places, including the glymphatic system, and eventually enters the venous blood23-25. Anatomically, the bulk volume of ISF/CSF drainage bypasses the BBB and BCSFB21-29. Unlike passive diffusion, clearance by convection out of the CNS does not require a favorable concentration gradient.
Without consumption of energy, in theory, passive diffusion alone does not produce Kp,uu > 1. Consequently, the Kp,uu < 1 precludes the possibility of passive diffusion back across the BBB and/or BCSFB. In this study, we have demonstrated that acetazolamide increases the Kp,uu of acetaminophen whereas AVP decreases the Kp,uu of both acetaminophen and ibuprofen. By ruling out passive diffusion back across BBB and/or BCSFB, active efflux and brain metabolism, the results are best explained by altering ISF/CSF production. Many medications do not undergo active efflux or brain metabolism. For broader implications, convective flow of ISF/CSF serves as the primary clearance mechanism out of CNS for compounds with Kp,uu < 1, which account for the majority of medications1,3,23,28,30.
Brain ISF/CSF production varies in circumstances such as circadian rhythm31, normal aging32, diseases such Alzheimer’s disease (AD)33,34, medications such as acetazolamide35, proton pump inhibitor omeprazole36 and AVP37. The variation in brain ISF/CSF production shall have impact on the CNS exposures of medications and may lead either efficacy or safety implications. ISF/CSF production rates can be modified for therapeutic usage. Restoring CSF production in AD patients may lead to increase CNS clearance of Aβ.
Founding and Consent for publication
The study was founded by and conducted at Biogen, Inc. The manuscript has been approved for publication by Biogen, Inc.
References
- Hammarlund-Udenaes M, Fridén M, Syvänen S, et al., On the rate and extent of drug delivery to the brain. Pharm Res. 2008; 25(8): 1737-50.
- Ferguson CS, Tyndale RF. Cytochrome P450 enzymes in the brain: emerging evidence of biological significance. Trends Pharmacol Sci. 2011; 32(12): 708-14.
- Wang Q, Delva L, Weinreb PH, et al. Monoclonal antibody exposure in rat and cynomolgus monkey cerebrospinal fluid following systemic administration. Fluids Barriers CNS. 2018; 15(1): 10.
- Geldenhuys WJ, Mohammad AS, Adkins CE, et al. Molecular determinants of blood-brain barrier permeation. Ther Deliv. 2015; 6(8): 961-71.
- Kokki H, Kumpulainen E, Lehtonen M, et al. Cerebrospinal fluid distribution of ibuprofen after intravenous administration in children. Pediatrics. 2007; 120(4): e1002-8.
- Westerhout J, Ploeger B, Smeets J, et al. Physiologically based pharmacokinetic modeling to investigate regional brain distribution kinetics in rats. AAPS J. 2012; 14(3): 543-53.
- Kumpulainen E, Kokki H, Halonen T, et al. Paracetamol (acetaminophen) penetrates readily into the cerebrospinal fluid of children after intravenous administration. Pediatrics. 2007; 119(4): 766-71.
- Vogh BP, Godman DR. Timolol plus acetazolamide: effect on formation of cerebrospinal fluid in cats and rats. Can J Physiol Pharmacol. 1985; 63(4): 340-3.
- Faraci FM, Mayhan WG, Heistad DD. Effect of vasopressin on production of cerebrospinal fluid: possible role of vasopressin (V1)-receptors. Am J Physiol. 1990; 258(1 Pt 2): R94-8.
- Liu X, Nakayama S, Amiry-Moghaddam M, et al. Arginine-vasopressin V1 but not V2 receptor antagonism modulates infarct volume, brain water content, and aquaporin-4 expression following experimental stroke. Neurocrit Care. 2010; 12(1): 124-31.
- de Lange EC. Utility of CSF in translational neuroscience. J Pharmacokinet Pharmacodyn. 2013; 40(3): 315-26.
- Supuran CT. Drug interaction considerations in the therapeutic use of carbonic anhydrase inhibitors. Expert Opin Drug Metab Toxicol. 2016; 12(4): 423-31.
- Wang W, Li C, Summer S, et al. Interaction between vasopressin and angiotensin II in vivo and in vitro: effect on aquaporins and urine concentration. Am J Physiol Renal Physiol. 2010; 299(3): F577-84.
- Katz DA, Locke C, Liu W, et al. Single-Dose Interaction Study of the Arginine Vasopressin Type 1B Receptor Antagonist ABT-436 and Alcohol in Moderate Alcohol Drinkers. Alcohol Clin Exp Res. 2016; 40(4): 838-45.
- Gordon AC, Mason AJ, Perkins GD, et al. The interaction of vasopressin and corticosteroids in septic shock: a pilot randomized controlled trial. Crit Care Med. 2014; 42(6): 1325-33.
- Ahmed MH, Ashton N, Balment RJ. Renal function in a rat model of analgesic nephropathy: effect of chloroquine. J Pharmacol Exp Ther. 2003; 305(1): 123-30.
- Benfenati V, Ferroni S. Water transport between CNS compartments: functional and molecular interactions between aquaporins and ion channels. Neuroscience. 2010; 168(4): 926-40.
- Hladky SB, Barrand MA. Fluid and ion transfer across the blood-brain and blood-cerebrospinal fluid barriers; a comparative account of mechanisms and roles. Fluids Barriers CNS. 2016; 13(1): 19.
- Oreškovi? D, Klarica M. A new look at cerebrospinal fluid movement. Fluids Barriers CNS. 2014; 11: 16.
- Hladky SB, Barrand MA. Mechanisms of fluid movement into, through and out of the brain: evaluation of the evidence. Fluids Barriers CNS. 2014; 11(1): 26.
- Brinker T, Stopa E, Morrison J, et al. A new look at cerebrospinal fluid circulation. Fluids Barriers CNS. 2014; 11: 10.
- Louveau A, Smirnov I, Keyes TJ, et al. Strucunctional features of central nervous system lymphatic vessels. Nature. 2015 Jul 16; 523 (7560): 337-41.
- Nakata T. virchow-robin space and aquaporin-4: new insights on an old friend. Croat Med J. 2014 Aug 28; 55(4): 328-36.
- Iliff JJ, Wang M, Liao Y, et al. A paravascular pathway facilitates CSF flow through the brain parenchyma and the clearance of interstitial solutes, including amyloid beta. Sci Transl Med. 2012; 4(147): 147ra111.
- Nedergaard M. Neuroscience. Garbage truck of the brain. Science. 2013; 340(6140): 1529-30.
- Battal B, Kocaoglu M, Bulakbasi N, et al. Cerebrospinal fluid flow imaging by using phase-contrast MR technique. Br J Radiol. 2011; 84(1004): 758-65.
- Cserr HF, Harling-Berg CJ, Knopf PM. Drainage of brain extracellular fluid into blood and deep cervical lymph and its immunological significance. Brain Pathol. 1992; 2(4): 269-76.
- Johanson CE, Duncan JA 3rd, Klinge PM, et al. Multiplicity of cerebrospinal fluid functions: New challenges in health and disease. Cerebrospinal Fluid Res. 2008; 5: 10.
- Sun BL, Wang LH, Yang T, et al. Lymphatic drainage system of the brain: A novel target for intervention of neurological diseases. Prog Neurobiol. 2017.
- Summerfield SG, Zhang Y, Liu H. Examining the Uptake of Central Nervous System Drugs and Candidates across the Blood-Brain Barrier. J Pharmacol Exp Ther. 2016; 358(2): 294-305.
- Nilsson C, Ståhlberg F, Thomsen C, et al. Circadian variation in human cerebrospinal fluid production measured by magnetic resonance imaging. Am J Physiol. 1992; 262(1 Pt 2): R20-4.
- May C, Kaye JA, Atack JR, et al. Cerebrospinal fluid production is reduced in healthy aging. Neurology. 1990; 40(3 Pt 1): 500-3.
- Silverberg GD, Heit G, Huhn S, et al. The cerebrospinal fluid production rate is reduced in dementia of the Alzheimer's type. Neurology. 2001; 57(10): 1763-6.
- Simon MJ, Iliff JJ. Regulation of cerebrospinal fluid (CSF) flow in neurodegenerative, neurovascular and neuroinflammatory disease. Biochim Biophys Acta. 2016; 1862(3): 442-51.
- Poca MA, Sahuquillo J. Short-term medical management of hydrocephalus. Expert Opin Pharmacother. 2005; 6(9): 1525-38.
- Lindvall-Axelsson M, Nilsson C, Owman C, et al. Inhibition of cerebrospinal fluid formation by omeprazole. Exp Neurol. 1992; 115(3): 394-9.
- Maktabi MA, Elbokl FF, Faraci FM, et al. Halothane decreases the rate of production of cerebrospinal fluid. Possible role of vasopressin V1 receptors. Anesthesiology. 1993; 78(1): 72-82.